Last active
April 26, 2024 09:00
-
-
Save jbburant/b3bd4961f3f5b03aeb542ed33a8fe062 to your computer and use it in GitHub Desktop.
This file contains bidirectional Unicode text that may be interpreted or compiled differently than what appears below. To review, open the file in an editor that reveals hidden Unicode characters.
Learn more about bidirectional Unicode characters
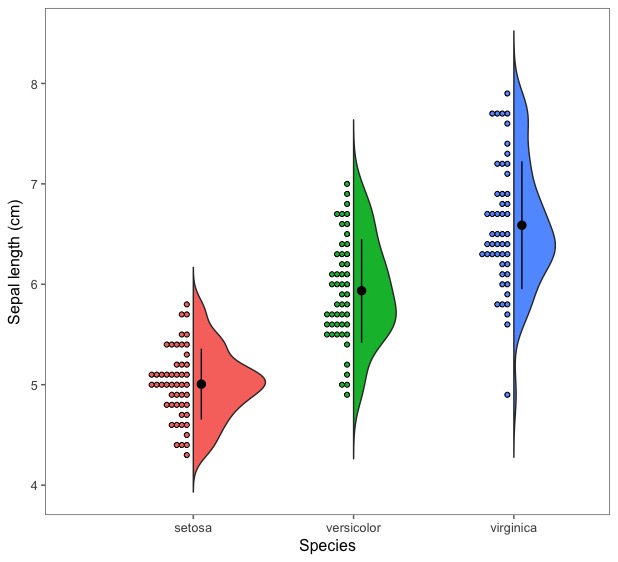
| ## GOAL: | |
| ## re-create a figure similar to Fig. 2 in Wilson et al. (2018), | |
| ## Nature 554: 183-188. Available from: | |
| ## https://www.nature.com/articles/nature25479#s1 | |
| ## | |
| ## combines a boxplot (or violin) with the raw data, by splitting each | |
| ## category location in two (box on left, raw data on right) | |
| # initial set-up ---------------------------------------------------------- | |
| ## set working directory | |
| getwd() | |
| ## call required packages | |
| library(tidyverse) | |
| library(ggthemes) | |
| ## load source code | |
| devtools::source_gist("2a1bb0133ff568cbe28d", | |
| filename = "geom_flat_violin.R") | |
| ## sourced from github "dgrtwo/geom_flat_violin.R | |
| ## set plotting theme | |
| theme_set(theme_few()) | |
| ## import data | |
| iris <- iris | |
| # half violin plot with raw data ------------------------------------------ | |
| ## create a violin plot of Sepal.Length per species | |
| ## using the custom function geom_flat_violin() | |
| ggplot(data = iris, | |
| mapping = aes(x = Species, | |
| y = Sepal.Length, | |
| fill = Species)) + | |
| geom_flat_violin(scale = "count", | |
| trim = FALSE) + | |
| stat_summary(fun.data = mean_sdl, | |
| fun.args = list(mult = 1), | |
| geom = "pointrange", | |
| position = position_nudge(0.05)) + | |
| geom_dotplot(binaxis = "y", | |
| dotsize = 0.5, | |
| stackdir = "down", | |
| binwidth = 0.1, | |
| position = position_nudge(-0.025)) + | |
| theme(legend.position = "none") + | |
| labs(x = "Species", | |
| y = "Sepal length (cm)") |
Author
jbburant
commented
Feb 20, 2018
Sign up for free
to join this conversation on GitHub.
Already have an account?
Sign in to comment