-
-
Save jdbcode/f4d56d72f7fc5beeaa3859999b1f5c3d to your computer and use it in GitHub Desktop.
Hi @hibajamal
That is a limitation of the function. The only way to get around it is to make a smaller rectangle or resample the image to have larger pixels like this:
band_arrs = img.reproject(crs=img.projection().crs(), scale=100).sampleRectangle(region=aoi)
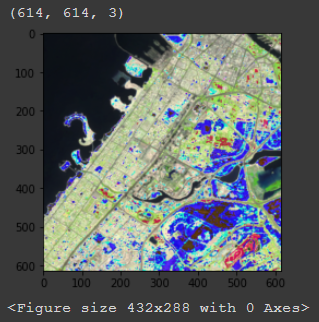
Thanks so much for the response, I tried limiting the size by fixing a small rectangle and now this, adding a high scale but that leads to giving a completely white image, or if the rectangle is too small, then a black image (since i kept defaultValue=0 in sampleRectangle).
Hey, @jdbcode,
Also, will rgb_img_test have to be changed or scaled according to the scale in img.reproject or not? Sorry I am just trying figure out why the output image looks like this (it is also the median of an image collection if that matters):
Thanks for the gist! Do you have any idea why if I use the COPERNICUS/S2_SR dataset sampleRectangle() returns a single pixel? I am sampling a region of 1000x1000 m and the resolution of the bands is 10 m, so I was expecting 100x100 pixels.
Here's my code:
collection = ee.ImageCollection('COPERNICUS/S2_SR')
collection = collection.filterDate('2020-01-01', '2020-01-30')
collection = collection.filter(ee.Filter.lt('CLOUDY_PIXEL_PERCENTAGE', 20))
collection = collection.map(maskS2clouds)

image = collection.mean()

region = ee.Geometry.Point(83.277, 17.7009).buffer(1000).bounds()
patch = image.sampleRectangle(region)
plt.imshow(np.dstack(([patch.get(b).getInfo() for b in ['B4', 'B3', 'B2']])))Image composites (collection.mean()) have a default projection of WGS84 with 1-degree scale and since the region is less than 1 degree, only a single pixel is returned. Set the projection of the mean composite manually with setDefaultProjection(). See suggested code edits for possible solution (untested).
region = ee.Geometry.Point(83.277, 17.7009).buffer(1000).bounds() # <-- move above collection def
collection = ee.ImageCollection('COPERNICUS/S2_SR')
collection = collection.filterBounds(region) # <-- filter by region intersection
collection = collection.filterDate('2020-01-01', '2020-01-30')
collection = collection.filter(ee.Filter.lt('CLOUDY_PIXEL_PERCENTAGE', 20))
collection = collection.map(maskS2clouds)

proj = collection.first().projection() # <-- get the projection of an image
image = collection.mean().setDefaultProjection(proj); # <--set projection of the composite

patch = image.sampleRectangle(region)
plt.imshow(np.dstack(([patch.get(b).getInfo() for b in ['B4', 'B3', 'B2']])))Thanks a lot @jdbcode! I didn't know about the default projection of image composites. Actually, I don't even need a composite, I just want to sample an image from that region (e.g. the most recent pass). So I fixed my code as follows:
collection = ee.ImageCollection('COPERNICUS/S2_SR')
collection = collection.filterDate('2017-03-28', '2020-06-27')
collection = collection.filter(ee.Filter.lt('CLOUDY_PIXEL_PERCENTAGE', 20))
collection = collection.map(maskS2clouds)

region = ee.Geometry.Point(7.411762, 43.725962).buffer(1000).bounds()
image = collection.filterBounds(region).limit(1, 'system:index', False).first()
bands = image.sampleRectangle(region, defaultValue=0)
patch = np.dstack(([bands.get(b).getInfo() for b in ['B4', 'B3', 'B2']]))

plt.imshow(patch/0.3)hello dear @jdbcode
I want to add a polygon (shapefile) to the array layer then add it to the base map (by contextily library) but I couldn't.
Could you help me, please?
if it not possible, how I should add just shapefile
%matplotlib inline

import pandas as pd

import geopandas as gpd

import contextily as cx

import matplotlib.pyplot as pl


band = mean2020.reproject(crs=img.projection().crs(), scale=4000)\
                    .sampleRectangle(region=aoi,defaultValue=0.0)

band_arr = band.get('tropospheric_NO2_column_number_density')
np_arr = np.array(band_arr.getInfo())

# convert to nan
np_arr[np_arr == 0.0] = np.nan


def plot_matrix(mat, figsize, title='NO2_Iran (mol/m^2)', cmap=plt.cm.get_cmap("rainbow")):


    plt.figure(figsize=figsize)
    ax=plt.subplot()

    #ax = plt.axes([0, 0.05, 0.9, 0.9 ]) #left, bottom, width, height
    #note that we are forcing width:height=1:1 here,
    #as 0.9*8 : 0.9*8 = 1:1, the figure size is (8,8)
    #if the figure size changes, the width:height ratio here also need to be changed


    plt.imshow(mat ,interpolation='nearest', cmap=cmap,vmin=min_str,vmax=max_str)
    ax=Iran.plot(color="None", edgecolor='black')
    cx.add_basemap(ax,crs=Iran.crs.to_string())
    #ax=fig.add_subplots()


    #ax.grid(False)
    #ax.set_title(title)

    cax = plt.axes([0.04, 0.17, 0.05,0.2 ])

    #plt.colorbar(mappable=im, cax=cax)
    # Add colorbar, make sure to specify tick locations to match desired ticklabels

    #norm = mpl.colors.Normalize(vmin=min, vmax=max)
    # creating ScalarMappable
    #sm = plt.cm.ScalarMappable(cmap=cmap, norm=norm)
    #sm.set_array([])
    #plt.colorbar(sm,cax=cax ,ticks=np.linspace(min, max, 5))

    #plt.savefig("C:/Users/Mohammad Reza/Desktop/NO2.png",dpi=100,quality=98,format='png')
    return ax, cax

data = np_arr
ax, cax = plot_matrix(data, (10,10))


@Mohammadreza20 If you are looking to just visualize the NO2 data with Iran state overlay in Python with matplotlib, you can do it all in server-side Earth Engine - you just transfer final visualization to Python client for plotting (regarding non-EE libraries for overlay, I'm not sure):
import ee
ee.Initialize()

import requests
from io import BytesIO
from PIL import Image
import matplotlib.pyplot as plt

# Get Iran admin boundry feature collection.
admin_poly = (ee.FeatureCollection("FAO/GAUL_SIMPLIFIED_500m/2015/level1")
  .filter(ee.Filter.eq('ADM0_NAME' , 'Iran  (Islamic Republic of)')));

# Get S5P NO2 collection.
col = (ee.ImageCollection("COPERNICUS/S5P/NRTI/L3_NO2")
  .filterBounds(admin_poly.geometry())
  .filterDate('2020-09-01', '2021-01-01')
  .select('tropospheric_NO2_column_number_density'));

# Calculate S5P NO2 collection mean.
mean2020 = col.mean();

# Reproject the data.
band = mean2020.reproject(**{'crs': col.first().projection().crs(), 'scale': 4000})

# Convert NO2 data to RGB visualization.
vis_img = band.visualize(**{
  'min': 0,
  'max': 0.000096,
  'palette': ['00007F', '002AFF', '00D4FF', '7FFF7F', 'FFD400', 'FF2A00', '7F0000']
});

# Convert Iran admin boundry feature collection to a raster w/ state outlines.
admin_raster = (ee.Image().byte().paint(**{
  'featureCollection': admin_poly,
  'color': '000000',
  'width': 2
}))

# Overlay the Iran raster state outlines on the NO2 visualization.
vis_img = vis_img.blend(admin_raster).clipToCollection(admin_poly)

# Get final visualization thumbnail URL.
url = vis_img.getThumbURL({'dimensions': 1024, 'region': admin_poly.geometry()})

# Get image content from the URL.
response = requests.get(url)
img = Image.open(BytesIO(response.content))

# Plot the image with matplotlib.
plt.imshow(img)
plt.show()
Hi dear @jdbcode
I do not know how to thank you, I have always done my job with your help and great tips, whether on GateHub or other sites, you answer everyone's questions very well and honestly,
I wrote more than a hundred lines of code to reach the result you wrote :)))))
Hey, incredibly sorry for bothering you again but, is there any way to set a scale or maxPixels parameter during (or after) the extraction of band values in sampleRectangle()?

It's just that I for a couple of regions and images, I keep getting the too many pixels error, and am out of ways to fix it. Help please (again, sorry).