01/13/2012. From a lecture by Professor John Ousterhout at Stanford, class CS140
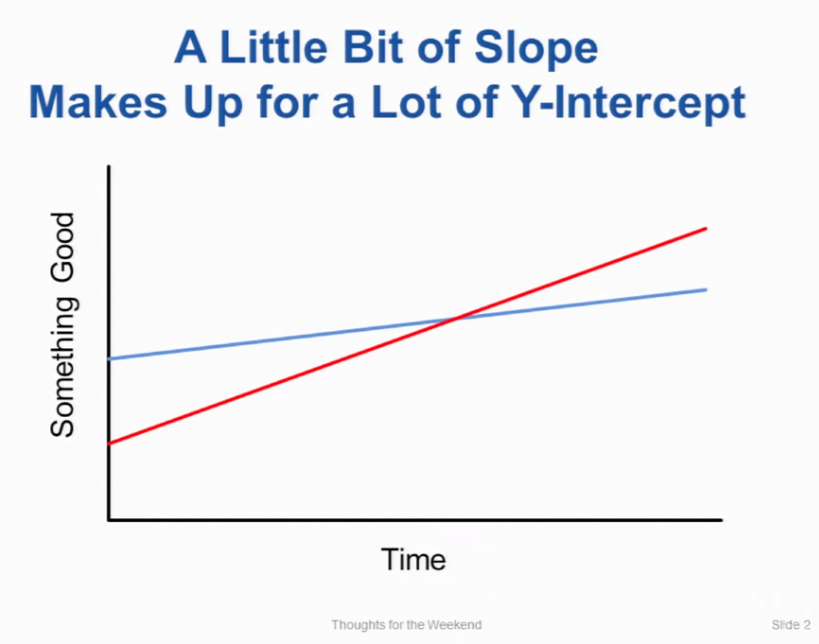
Here's today's thought for the weekend. A little bit of slope makes up for a lot of Y-intercept.
[Laughter]
| # load dynamic modules | |
| load_module /etc/nginx/modules/ngx_http_geoip_module.so; | |
| user nginx; | |
| worker_processes auto; | |
| error_log /var/log/nginx/error.log info; | |
| pid /var/run/nginx.pid; | |
| events { worker_connections 1024; } | |
| http { |
| # repo history cleanup | |
| # https://rtyley.github.io/bfg-repo-cleaner/ | |
| # https://github.com/IBM/BluePic/wiki/Using-BFG-Repo-Cleaner-tool-to-remove-sensitive-files-from-your-git-repo | |
| download bfg jar file | |
| # https://search.maven.org/classic/remote_content?g=com.madgag&a=bfg&v=LATEST | |
| ```bash | |
| curl https://repo1.maven.org/maven2/com/madgag/bfg/1.13.0/bfg-1.13.0.jar > bfg.jar | |
| git clone http://yourrepo | |
| cd yourrepo |
A lot of people land when trying to find out how to calculate CPU usage metric correctly in prometheus, myself included! So I'll post what I eventually ended up using as I think it's still a little difficult trying to tie together all the snippets of info here and elsewhere.
This is specific to k8s and containers that have CPU limits set.
To show CPU usage as a percentage of the limit given to the container, this is the Prometheus query we used to create nice graphs in Grafana:
sum(rate(container_cpu_usage_seconds_total{name!~".*prometheus.*", image!="", container_name!="POD"}[5m])) by (pod_name, container_name) /
| #!/usr/bin/env bash | |
| # get_server.sh (c) NGINX, Inc. [v0.3 10-Jul-2019] Liam Crilly <liam.crilly@nginx.com> | |
| if [ $# -lt 1 ]; then | |
| echo "USAGE: ${0##*/} [URI ...]" | |
| exit 1 | |
| fi | |
| for site in "$@"; do | |
| echo -n "$site " |