Under load, the yugabyte clusters showed a latency spike ~ every 30 seconds. Latencies went up to 4 seconds.
Aside from the main problem, we found that one of the servers in the cluster showed CPU saturation during those
spikes. Since the spikes were frequent enough, top could be used to identify the yb-master process as the
culprit. We could identify this node as the leader master of the YB cluster.
Usually, it's easier to debug latency spikes under CPU load than when there is little load. The reason is that when CPUs are executing something this can be observed in profiling. When processes are sleeping or waiting on something on the other hand, it can be many things and it's often hard to come up with an initial idea of where to look further.
Using pidstat -tu, one could see that the load distributed to dozens of threads in thread pools of the yb-master
process.
perf top did not show anything immediately obvious. A flame graph showed a very clear picture, though, with most
CPU time going to a single call stack:
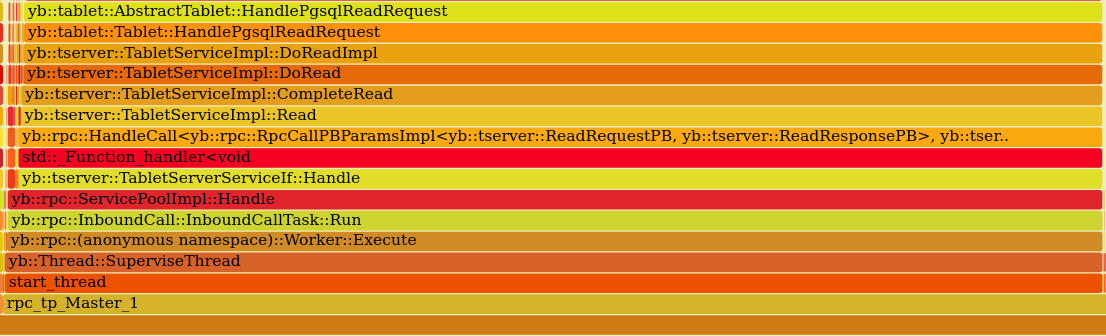
Using perf script this particular example was collected:
            7fe488651022 yb::tablet::AbstractTablet::HandlePgsqlReadRequest+0x222 (/home/yugabyte/yb-software/yugabyte-2.12.1.0-b41-centos-x86_64/lib/yb/libtablet.so)
            7fe488680943 yb::tablet::Tablet::HandlePgsqlReadRequest+0x2b3 (/home/yugabyte/yb-software/yugabyte-2.12.1.0-b41-centos-x86_64/lib/yb/libtablet.so)
            7fe4892008f6 yb::tserver::TabletServiceImpl::DoReadImpl+0x826 (/home/yugabyte/yb-software/yugabyte-2.12.1.0-b41-centos-x86_64/lib/yb/libtserver.so)
            7fe489201a2c yb::tserver::TabletServiceImpl::DoRead+0x7c (/home/yugabyte/yb-software/yugabyte-2.12.1.0-b41-centos-x86_64/lib/yb/libtserver.so)
            7fe489201dec yb::tserver::TabletServiceImpl::CompleteRead+0x14c (/home/yugabyte/yb-software/yugabyte-2.12.1.0-b41-centos-x86_64/lib/yb/libtserver.so)
            7fe489203d8d yb::tserver::TabletServiceImpl::Read+0x14cd (/home/yugabyte/yb-software/yugabyte-2.12.1.0-b41-centos-x86_64/lib/yb/libtserver.so)
            7fe485008da6 yb::rpc::HandleCall<yb::rpc::RpcCallPBParamsImpl<yb::tserver::ReadRequestPB, yb::tserver::ReadResponsePB>, yb::tserver::TabletServerServiceIf::InitMethods(scoped_refptr<yb::MetricEntity> const&)::{lambda(std::shared_ptr<yb::rpc::InboundCall>)#2}::operator()(std::shared_ptr<yb::rpc::InboundCall>) const::{lambda(yb::tserver::ReadRequestPB const*, yb::tserver::ReadResponsePB*, yb::rpc::RpcContext)#1}>+0x3c6 (/home/yugabyte/yb-software/yugabyte-2.12.1.0-b41-centos-x86_64/lib/yb/libtserver_service_proto.so)
            7fe485008f5d std::_Function_handler<void (std::shared_ptr<yb::rpc::InboundCall>), yb::tserver::TabletServerServiceIf::InitMethods(scoped_refptr<yb::MetricEntity> const&)::{lambda(std::shared_ptr<yb::rpc::InboundCall>)#2}>::_M_invoke+0x4d (/home/yugabyte/yb-software/yugabyte-2.12.1.0-b41-centos-x86_64/lib/yb/libtserver_service_proto.so)
            7fe484ffe304 yb::tserver::TabletServerServiceIf::Handle+0x54 (/home/yugabyte/yb-software/yugabyte-2.12.1.0-b41-centos-x86_64/lib/yb/libtserver_service_proto.so)
            7fe47f76a8ce yb::rpc::ServicePoolImpl::Handle+0x10e (/home/yugabyte/yb-software/yugabyte-2.12.1.0-b41-centos-x86_64/lib/yb/libyrpc.so)
            7fe47f70ca94 yb::rpc::InboundCall::InboundCallTask::Run+0x44 (/home/yugabyte/yb-software/yugabyte-2.12.1.0-b41-centos-x86_64/lib/yb/libyrpc.so)
            7fe47f77e618 yb::rpc::(anonymous namespace)::Worker::Execute+0x438 (/home/yugabyte/yb-software/yugabyte-2.12.1.0-b41-centos-x86_64/lib/yb/libyrpc.so)
            7fe47e8c0b35 yb::Thread::SuperviseThread+0x675 (/home/yugabyte/yb-software/yugabyte-2.12.1.0-b41-centos-x86_64/lib/yb/libyb_util.so)
            7fe479c08694 start_thread+0xc4 (/home/yugabyte/yb-software/yugabyte-2.12.1.0-b41-centos-x86_64/linuxbrew/lib/libpthread-2.23.so)
Reading through the yugabyte source code, it turns out that these traces are processing requests to read rows from yugabyte tables. Multiple questions arise:
- Where do these requests originate from? Do they arrive over the network?
- It is somewhat surprising that most of the trace mentions "tserver" and not "master" which are the two main components of a Yugabyte cluster. What data would be read from the master?
- What is the underlying reason for those requests and why are there so many?
- What triggers the condition in our usage and environment of running Yugabyte?
Next step was to enable more debugging in the master servers. Looking through the options defined in the source code,
--rpc_dump_all_traces=true seemed interesting. In fact, this gave us some initial idea of what kind of traffic we
are looking at and in which context.
I0405 12:03:01.982240 20640 yb_rpc.cc:406] Call yb.master.MasterService.GetTabletLocations 10.1.0.29:49660 => 10.1.0.29:7100 (request call id 71) took 0ms.
I0405 12:03:01.983266 21505 yb_rpc.cc:406] Call yb.master.MasterService.GetTableSchema 10.1.0.24:43978 => 10.1.0.29:7100 (request call id 58081159) took 0ms.
I0405 12:03:01.983441 22475 yb_rpc.cc:406] Call yb.master.MasterService.GetTableLocations 10.1.0.24:58013 => 10.1.0.29:7100 (request call id 58081158) took 0m
I0405 12:03:01.984544 23178 yb_rpc.cc:406] Call yb.master.MasterService.GetTableSchema 10.1.0.24:42331 => 10.1.0.29:7100 (request call id 58081164) took 0ms.
I0405 12:03:01.984683 21317 yb_rpc.cc:406] Call yb.master.MasterService.GetTableLocations 10.1.0.24:59336 => 10.1.0.29:7100 (request call id 58081163) took 0ms.
I0405 12:03:01.985738 22479 yb_rpc.cc:406] Call yb.tserver.TabletServerService.Read 10.1.0.24:46720 => 10.1.0.29:7100 (request call id 26) took 0ms.
I0405 12:03:01.986397 21160 yb_rpc.cc:406] Call yb.tserver.TabletServerService.Read 10.1.0.24:46720 => 10.1.0.29:7100 (request call id 27) took 0ms.
I0405 12:03:01.987068 18129 yb_rpc.cc:406] Call yb.master.MasterService.GetTableSchema 10.1.0.24:42962 => 10.1.0.29:7100 (request call id 58081167) took 0ms.
The traffic is related to metadata updates and, indeed, comes in from the same and other nodes of the Yugabyte cluster.
In the next step, we tried to identify which processes own the connections sending these kinds of traffic. We ran the
performance test again and while the traffic came in, looked at netstat -np | grep <port> (on the right node) to associate
the process with the connection.
It turns out that the traffic mostly originated from postgres processes.
Yugabyte uses three main processes:
- master: manages the cluster and provides table metadata
- tserver: manages and provides access to the user data
- postgres: postgres frontend spawned by tservers to handle incoming queries
The architecture pages in the documentation show the approximate call path, however, the actual logic and code is quite complicated. With all these three processes sharing some code.
Next, networking data was captured with tcpdump. Here's an IO graph captured during a spike:

The black line is all traffic and the blue line is traffic to master (port 7100). The latency hiccup happens during the spike of the blue line. Before the hiccup, there is almost no traffic to the master and all the traffic is actually user data traffic. During the spike, total traffic goes down and master traffic amounts to the majority of all traffic.
Next, TLS encryption inside our YB cluster was disabled to have a look at the actual request data. In YB, RPC traffic is based on protobuf and we could have decoded it, but even the plain text parts revealed that the traffic was all about table metadata (and that traffic was duplicated over all the postgres process connections):
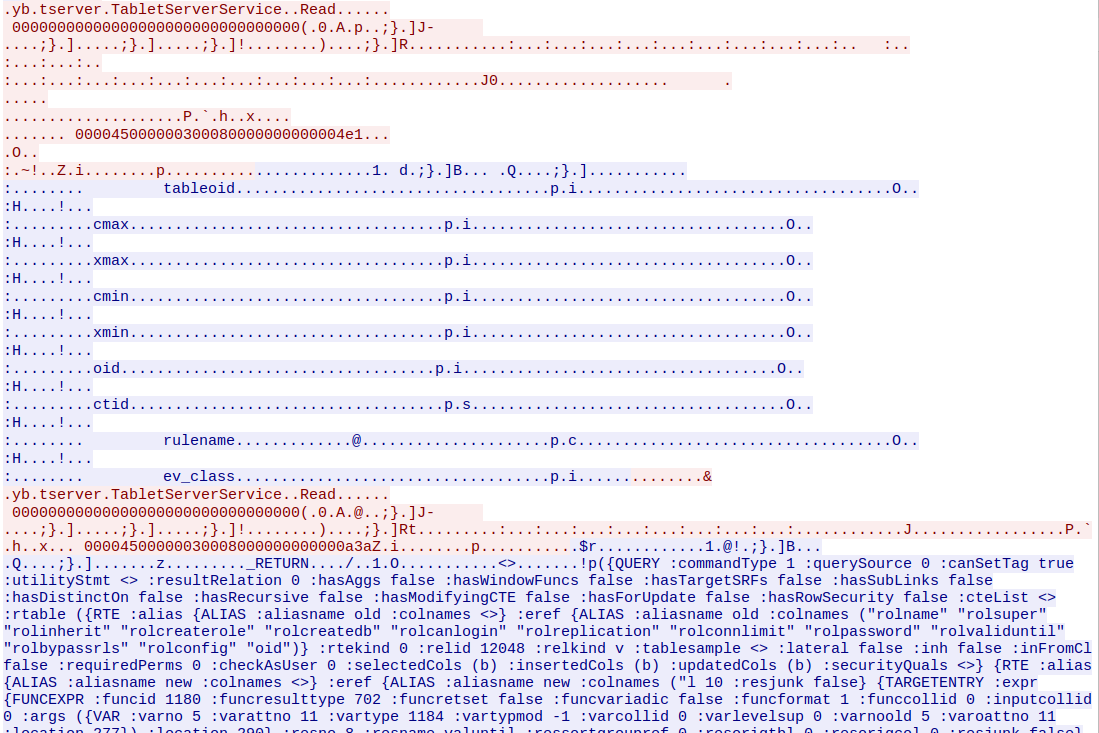
One such conversation consists of dozens of RPCs and >100kB of data transferred.
Reading through master code, it was shown that the master gives access to metadata tables using similar code as tservers giving access to user data. During the latency spike the master has to handle thousands of these requests coming in from postgres frontends from all over the cluster.
Why do postgres clients have to refresh table metadata, all at the same time? Turning on more logging did not help, we suspected that due to the high load, some components of the YB cluster might be seen as offline, so that the topology of the database table store would change dynamically, but we could rule that out.
Finally, we ran another round of perf record / perf script on the nodes generating the traffic on the assumption that
during the latency spike, those nodes would do nothing else than triggering the traffic. The stack trace of how that
triggering was happing would give us another indication of what was going on.
And indeed, we were lucky and captured this stack trace:
postgres  5748 [004] 85691.508689:    3344481 cpu-clock:
                  a3a751 AllocSetFree+0x11 (/home/yugabyte/yb-software/yugabyte-2.12.1.0-b41-centos-x86_64/postgres/bin/postgres)
                  9e07f3 ResetCatalogCache+0x283 (/home/yugabyte/yb-software/yugabyte-2.12.1.0-b41-centos-x86_64/postgres/bin/postgres)
                  9e1e0c ResetCatalogCaches+0x2c (/home/yugabyte/yb-software/yugabyte-2.12.1.0-b41-centos-x86_64/postgres/bin/postgres)
                  87ce01 YBRefreshCache+0x81 (/home/yugabyte/yb-software/yugabyte-2.12.1.0-b41-centos-x86_64/postgres/bin/postgres)
                  881b86 PostgresMain+0xb06 (/home/yugabyte/yb-software/yugabyte-2.12.1.0-b41-centos-x86_64/postgres/bin/postgres)
                  49e282 ServerLoop+0x1096 (/home/yugabyte/yb-software/yugabyte-2.12.1.0-b41-centos-x86_64/postgres/bin/postgres)
                  7ea5ff PostmasterMain+0x11ff (/home/yugabyte/yb-software/yugabyte-2.12.1.0-b41-centos-x86_64/postgres/bin/postgres)
                  735c6a PostgresServerProcessMain+0x47a (/home/yugabyte/yb-software/yugabyte-2.12.1.0-b41-centos-x86_64/postgres/bin/postgres)
                  735e69 main+0x20 (/home/yugabyte/yb-software/yugabyte-2.12.1.0-b41-centos-x86_64/postgres/bin/postgres)
            7f04627e1825 __libc_start_main+0xf5 (/home/yugabyte/yb-software/yugabyte-2.12.1.0-b41-centos-x86_64/linuxbrew/lib/libc-2.23.so)
ResetCatalogCaches was the culprit. Looking through the source code again, it could be seen that those caches are
invalidated when the "yugabyte catalog version" is incremented during processing. Further digging revealed, that this
probably happens when schemas are updated (using DDL statements) while read queries are running.
With that clue revealed, we quickly suspected that our own deployment infrastructure might be executing DDLs regularly. And indeed, we were running synchronization scripts frequently (every 30 seconds), to make sure permissions were set accurately. Even if the statements didn't actually alter anything, they still increased the catalog version and triggered the cache invalidation. After it was found, we could quickly fix this condition on our end.
- Could YB be more intelligent about updating the catalog version? Maybe: yugabyte/yugabyte-db#11997
- Traffic from postgres frontends is amplified by the fact, that tservers dymanically create postgres frontend processes as needed. Under load there might be dozens of such processes all doing the same queries again the single master leader at the same time. This is a potential scalability hazard. Indeed, upcoming changes to the YB architecture might help in that regard: yugabyte/yugabyte-db#10821
- top, sysstat, pidstat, netstat
- perf top, perf record, perf script, FlameGraph
- tcpdump and wireshark
- Lots of source code reading