|
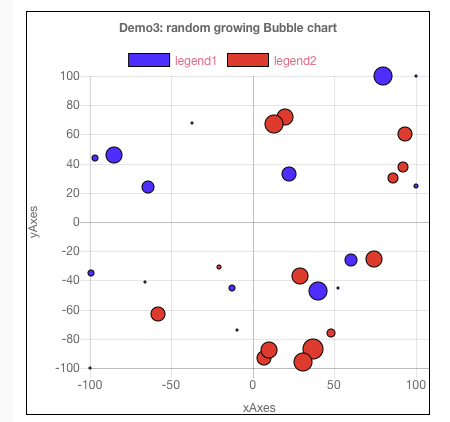
[{"id":"35e1e32f.937e74","type":"tab","label":"Demo 1: Static","disabled":false,"info":""},{"id":"5c66fca0.b4e21c","type":"tab","label":"Demo 2: dynamic","disabled":false,"info":""},{"id":"ed34b63.0ee70c8","type":"tab","label":"Demo 3: dynamic growing","disabled":false,"info":""},{"id":"f96b2dc5.3197c","type":"ui_base","theme":{"name":"theme-light","lightTheme":{"default":"#0094CE","baseColor":"#0094CE","baseFont":"-apple-system,BlinkMacSystemFont,Segoe UI,Roboto,Oxygen-Sans,Ubuntu,Cantarell,Helvetica Neue,sans-serif","edited":true,"reset":false},"darkTheme":{"default":"#097479","baseColor":"#097479","baseFont":"-apple-system,BlinkMacSystemFont,Segoe UI,Roboto,Oxygen-Sans,Ubuntu,Cantarell,Helvetica Neue,sans-serif","edited":false},"customTheme":{"name":"Untitled Theme 1","default":"#4B7930","baseColor":"#4B7930","baseFont":"-apple-system,BlinkMacSystemFont,Segoe UI,Roboto,Oxygen-Sans,Ubuntu,Cantarell,Helvetica Neue,sans-serif"},"themeState":{"base-color":{"default":"#0094CE","value":"#0094CE","edited":false},"page-titlebar-backgroundColor":{"value":"#0094CE","edited":false},"page-backgroundColor":{"value":"#fafafa","edited":false},"page-sidebar-backgroundColor":{"value":"#ffffff","edited":false},"group-textColor":{"value":"#1bbfff","edited":false},"group-borderColor":{"value":"#ffffff","edited":false},"group-backgroundColor":{"value":"#ffffff","edited":false},"widget-textColor":{"value":"#111111","edited":false},"widget-backgroundColor":{"value":"#0094ce","edited":false},"widget-borderColor":{"value":"#ffffff","edited":false},"base-font":{"value":"-apple-system,BlinkMacSystemFont,Segoe UI,Roboto,Oxygen-Sans,Ubuntu,Cantarell,Helvetica Neue,sans-serif"}}},"site":{"name":"Node-RED Dashboard","hideToolbar":"false","allowSwipe":"false","allowTempTheme":"true","dateFormat":"DD/MM/YYYY","sizes":{"sx":48,"sy":48,"gx":6,"gy":6,"cx":6,"cy":6,"px":0,"py":0}}},{"id":"21fb4565.85565a","type":"ui_group","z":"","name":"demo 1","tab":"a4054538.f69598","order":1,"disp":false,"width":"12","collapse":false},{"id":"a4054538.f69598","type":"ui_tab","z":"","name":"Demo 1: static","icon":"dashboard","order":1},{"id":"62e84868.707968","type":"ui_tab","z":"","name":"Demo 3: dynamic growing","icon":"dashboard","order":3},{"id":"ed68b86d.026b2","type":"ui_group","z":"","name":"demo 3","tab":"62e84868.707968","order":1,"disp":false,"width":"12","collapse":false},{"id":"5d771aac.b2fbac","type":"ui_tab","z":"","name":"Demo 2: dynamic","icon":"dashboard","order":2},{"id":"a1a4b9da.737a38","type":"ui_group","z":"","name":"demo 2","tab":"5d771aac.b2fbac","order":1,"disp":false,"width":"12","collapse":false},{"id":"776da4f7.706a64","type":"ui_template","z":"35e1e32f.937e74","group":"21fb4565.85565a","name":"Bubble Chart (static)","order":2,"width":"8","height":"8","format":"<canvas id=\"bubble-static\" width=\"1\" height=\"1\" style=\"border:1px solid #000000;\"></canvas>\n\n<script>\nnew Chart(document.getElementById(\"bubble-static\"), {\n type: 'bubble',\n data: {\n labels: \"label\",\n datasets: [\n {\n label: \"Bases\",\n backgroundColor: \"rgba(255, 216, 0, 1.0)\",\n borderColor: \"#000\",\n data: [\n \t{ x: -85, y: 79, r: 2 },\n \t{ x: 385, y: -279, r: 2 },\n \t{x: 207, y: -461, r: 2 },\n \t{x: 262, y: -548, r: 2 },\n \t{x: 388, y: -1320, r: 2 },\n \t{x: 415, y: 185, r: 2 },\n \t{x: 584, y: -1100, r: 2 }\n ]\n }, {\n label: [\"POI\"], \n backgroundColor: \"rgba(72, 255, 70,1.0)\",\n borderColor: \"#000\",\n data: [\n \t{x: 106, y: -381, r: 2 },\n \t{x: 174, y: -119, r: 2 },\n \t{x: 185, y: -780, r: 2 },\n \t{x: 244, y: -1113, r: 2 },\n \t{x: 261, y: -1319, r: 2 },\n \t{x: 296, y: -100, r: 2 }\n\t\t ]\n }\n ]\n },\n options: {\n legend: {\n display: true,\n labels: {\n fontColor: 'rgb(255, 99, 132)'\n }\n },\n title: {\n display: true,\n text: 'Demo1: static Bubble chart'\n }, scales: {\n yAxes: [{ \n scaleLabel: {\n display: true,\n labelString: \"yAxes\"\n }\n }],\n xAxes: [{ \n scaleLabel: {\n display: true,\n labelString: \"xAxes\"\n }\n }]\n }\n }\n});\n\n</script>\n","storeOutMessages":true,"fwdInMessages":true,"templateScope":"local","x":180,"y":100,"wires":[[]]},{"id":"675201b7.44678","type":"debug","z":"ed34b63.0ee70c8","name":"","active":false,"tosidebar":true,"console":false,"tostatus":false,"complete":"true","x":470,"y":220,"wires":[]},{"id":"4b31a900.53d8e8","type":"debug","z":"ed34b63.0ee70c8","name":"","active":false,"tosidebar":true,"console":false,"tostatus":false,"complete":"true","x":470,"y":280,"wires":[]},{"id":"7118e1f3.a55ad","type":"function","z":"ed34b63.0ee70c8","name":"Build two cumulating random datasets","func":"// this is where you define the legend for \n// the datasets\nvar title = \"Demo3: random growing Bubble chart\";\nvar legend1 = \"legend1\";\nvar legend2 = \"legend2\";\n\n// variables to be used to \nvar i, x, y, r, data1, data2;\n// initialise the counter to 0 if it doesn't exist already\nvar data1 = flow.get('data1')||'';\nvar data2 = flow.get('data2')||'';\n\nvar count = flow.get('count')||0;\ncount += 1;\nif (count > 15) {\n count = 1;\n data1 = '{x: 100, y: 100, r: 1},'; // Force the size of the\n data2 = '{x: -100, y: -100, r: 1},'; // plot so it won't resize\n} \n// store the value back\nflow.set('count',count);\n// make it part of the outgoing msg object\nmsg.count = count;\n\n// for dataset #1\n// this code generates one x/y point \n// between -100 and +100 and a random \n//size between 1 and 10\n//node.warn(\"db1=\"+data1);\nx = getRndInteger(-100,100);\ny = getRndInteger(-100,100);\nr = getRndInteger(0,10);\ndata1 += \"{x: \"+x+\", y: \"+y+\", r: \"+r+\"},\";\n//node.warn(\"db2=\"+data1);\n// this line removes the last comma to end the dataset\ndata1 = data1.replace(/^(.*),(.*?)$/, '$1')\n\n// for dataset #2\n// this code generates one x/y point \n// between -100 and +100 and a random \n//size between 1 and 10\n\nx = getRndInteger(-100,100);\ny = getRndInteger(-100,100);\nr = getRndInteger(1,10);\ndata2 += \"{x: \"+x+\", y: \"+y+\", r: \"+r+\"},\";\n\n// this line removes the last comma to end the dataset\ndata2 = data2.replace(/^(.*),(.*?)$/, '$1')\n\n// Now we build msg.payload\nmsg.payload = { \"title\" : title,\n \"legend1\" : legend1,\n \"data1\" : data1,\n \"legend2\" : legend2,\n \"data2\" : data2};\ndata1 += \",\";\ndata2 += \",\";\n\nflow.set([\"data1\", \"data2\"], [data1, data2]);\nreturn msg;\n\n// this code gets a random interger\nfunction getRndInteger(min, max) {\n return Math.floor(Math.random() * (max - min + 1) ) + min;\n}\n","outputs":1,"noerr":0,"x":230,"y":160,"wires":[["7ed7ca70.b0a8fc","aeee9b3a.3c13a"]]},{"id":"7ed7ca70.b0a8fc","type":"debug","z":"ed34b63.0ee70c8","name":"","active":false,"tosidebar":true,"console":false,"tostatus":false,"complete":"true","x":470,"y":160,"wires":[]},{"id":"52f5764.47eec88","type":"inject","z":"ed34b63.0ee70c8","name":"Inject every second","topic":"","payload":"","payloadType":"str","repeat":"1","crontab":"","once":false,"onceDelay":0.1,"x":180,"y":100,"wires":[["7118e1f3.a55ad"]]},{"id":"aeee9b3a.3c13a","type":"template","z":"ed34b63.0ee70c8","name":"Create the msg.template to use","field":"template","fieldType":"msg","format":"html","syntax":"mustache","template":"<canvas id=\"bubble-chart\" width=\"1\" height=\"1\" style=\"border:1px solid #000000;\"></canvas>\n\n<script>\nnew Chart(document.getElementById(\"bubble-chart\"), {\n type: 'bubble',\n data: {\n labels: \"label\",\n datasets: [\n {\n label: \"{{{payload.legend1}}}\",\n backgroundColor: \"rgba(65, 72, 255, 1.0000)\",\n borderColor: \"#000\",\n data: [\n {{{payload.data1}}}\n\n ]\n }, {\n label: [\"{{{payload.legend2}}}\"], \n backgroundColor: \"rgba(255, 45, 36, 1.0000)\",\n borderColor: \"#000\",\n data: [\n {{{payload.data2}}}\n\t\t ]\n }\n ]\n },\n options: {\n animation: false,\n legend: {\n display: true,\n labels: {\n fontColor: 'rgb(255, 99, 132)'\n }\n },\n title: {\n display: true,\n text: '{{{payload.title}}}'\n }, scales: {\n yAxes: [{ \n scaleLabel: {\n display: true,\n labelString: \"yAxes\"\n }\n }],\n xAxes: [{ \n scaleLabel: {\n display: true,\n labelString: \"xAxes\"\n }\n }]\n }\n }\n});\n\n</script>\n","output":"str","x":210,"y":220,"wires":[["675201b7.44678","90a482c4.75a6f"]]},{"id":"806c0bc9.f33db","type":"comment","z":"ed34b63.0ee70c8","name":"Dynamic Bubble chart adding new points (up to 15)","info":"This demo creates a ","x":250,"y":40,"wires":[]},{"id":"90a482c4.75a6f","type":"ui_template","z":"ed34b63.0ee70c8","group":"ed68b86d.026b2","name":"Bubble (dynamic growing)","order":2,"width":"8","height":"8","format":"this will be ignored","storeOutMessages":false,"fwdInMessages":true,"templateScope":"local","x":190,"y":280,"wires":[["4b31a900.53d8e8"]]},{"id":"d9b38376.3718b","type":"inject","z":"ed34b63.0ee70c8","name":"Description","topic":"","payload":"This demo creates a bubble chart showing how you could dynamically add points to the plot. It initially creates two points (100, 100 and -100, -100) to create a fixed size area for the plot. <br><br> It then reiterates 15 times adding a point to each dataset and displaying the plot again. It also removes the animation so the points just appear on the plot.","payloadType":"str","repeat":"","crontab":"","once":false,"onceDelay":0.1,"x":150,"y":340,"wires":[["467429fe.4d4f98"]]},{"id":"ddfaa9da.2513b8","type":"debug","z":"5c66fca0.b4e21c","name":"","active":false,"tosidebar":true,"console":false,"tostatus":false,"complete":"true","x":470,"y":220,"wires":[]},{"id":"d19083e3.c4e8f8","type":"debug","z":"5c66fca0.b4e21c","name":"","active":false,"tosidebar":true,"console":false,"tostatus":false,"complete":"true","x":470,"y":280,"wires":[]},{"id":"a8d7b7c8.c00498","type":"function","z":"5c66fca0.b4e21c","name":"Build the datsets to be displayed","func":"// this is where you define the legend for \n// the datasets\nvar title = \"Demo2: dynamic random Bubble chart\";\nvar legend1 = \"legend1\";\nvar legend2 = \"legend2\";\n\n// variables to be used to \nvar i, x, y, r, data1, data2;\nvar data1 = '';\nvar data2 = '';\n\n// for dataset #1\n// this code generates between 3 and 25 random\n// x/y points each between -100 and +100\n// and a random size between 1 and 2\nvar data_items = getRndInteger(3,15);\n\nfor (i = 0; i < data_items; i++) {\n x = getRndInteger(-100,100);\n y = getRndInteger(-100,100);\n r = getRndInteger(0,2);\n data1 += \"{x: \"+x+\", y: \"+y+\", r: \"+r+\"},\";\n}\n// this line removes the last comma to end the dataset\ndata1 = data1.replace(/^(.*),(.*?)$/, '$1')\nmsg.payload = {\"data1\": data1};\n\n// for dataset #2\n// this code generates between 3 and 25 random\n// x/y points each between -100 and +100\n// and a random size between 1 and 2\n\n data_items = getRndInteger(3,15);\n\nfor (i = 0; i < data_items; i++) {\n x = getRndInteger(-100,100);\n y = getRndInteger(-100,100);\n r = getRndInteger(1,2);\n data2 += \"{x: \"+x+\", y: \"+y+\", r: \"+r+\"},\";\n}\n// this line removes the last comma to end the dataset\ndata2 = data2.replace(/^(.*),(.*?)$/, '$1')\n\n// Now we build msg.payload\nmsg.payload = { \"title\" : title,\n \"legend1\" : legend1,\n \"data1\" : data1,\n \"legend2\" : legend2,\n \"data2\" : data2};\nreturn msg;\n\n// this code gets a random interger\nfunction getRndInteger(min, max) {\n return Math.floor(Math.random() * (max - min + 1) ) + min;\n}\n","outputs":1,"noerr":0,"x":220,"y":160,"wires":[["5662b8a0.f683a8","ea57d27b.488398"]]},{"id":"5662b8a0.f683a8","type":"debug","z":"5c66fca0.b4e21c","name":"","active":false,"tosidebar":true,"console":false,"tostatus":false,"complete":"true","x":470,"y":160,"wires":[]},{"id":"42741016.e5a2c8","type":"inject","z":"5c66fca0.b4e21c","name":"","topic":"","payload":"Inject every 3 seconds","payloadType":"str","repeat":"3","crontab":"","once":true,"onceDelay":0.1,"x":190,"y":100,"wires":[["a8d7b7c8.c00498"]]},{"id":"ea57d27b.488398","type":"template","z":"5c66fca0.b4e21c","name":"Create the msg.template to use","field":"template","fieldType":"msg","format":"html","syntax":"mustache","template":"<canvas id=\"bubble-chart\" width=\"1\" height=\"1\" style=\"border:1px solid #000000;\"></canvas>\n\n<script>\nnew Chart(document.getElementById(\"bubble-chart\"), {\n type: 'bubble',\n data: {\n labels: \"label\",\n datasets: [\n {\n label: \"{{{payload.legend1}}}\",\n backgroundColor: \"rgba(65, 72, 255, 1.0000)\",\n borderColor: \"#000\",\n data: [\n {{{payload.data1}}}\n\n ]\n }, {\n label: [\"{{{payload.legend2}}}\"], \n backgroundColor: \"rgba(255, 45, 36, 1.0000)\",\n borderColor: \"#000\",\n data: [\n {{{payload.data2}}}\n\t\t ]\n }\n ]\n },\n options: {\n legend: {\n display: true,\n labels: {\n fontColor: 'rgb(255, 99, 132)'\n }\n },\n title: {\n display: true,\n text: '{{{payload.title}}}'\n }, scales: {\n yAxes: [{ \n scaleLabel: {\n display: true,\n labelString: \"yAxes\"\n }\n }],\n xAxes: [{ \n scaleLabel: {\n display: true,\n labelString: \"xAxes\"\n }\n }]\n }\n }\n});\n\n</script>\n","output":"str","x":210,"y":220,"wires":[["ddfaa9da.2513b8","1d2b2d64.63418b"]]},{"id":"3d389e03.8d368a","type":"comment","z":"5c66fca0.b4e21c","name":"Dynamic Bubble chart with 15 points per dataset","info":"","x":240,"y":40,"wires":[]},{"id":"a4efa622.e373a","type":"inject","z":"5c66fca0.b4e21c","name":"Description","topic":"","payload":"This demo creates a bubble chart showing how you could, in a 'function' node, dynamically add points to the datasets sent to the chart. <br><br>It creates 15 random data points for each dataset and then sends the entire set of points at one time, waits 3 seconds and repeats.","payloadType":"str","repeat":"","crontab":"","once":true,"onceDelay":0.1,"x":150,"y":340,"wires":[["115e414a.fe70ef"]]},{"id":"51dd8974.23fe18","type":"ui_text","z":"35e1e32f.937e74","group":"21fb4565.85565a","order":1,"width":"8","height":"3","name":"demo 1 description","label":"","format":"{{msg.payload}}","layout":"col-center","x":510,"y":340,"wires":[]},{"id":"cf71d781.a18048","type":"inject","z":"35e1e32f.937e74","name":"Description","topic":"","payload":"This demo creates a bubble chart showing how you could statically add the points in the ui_template node.<br><br> While this is not very useful, it is the basis of the dynamic charts in the other tabs. ","payloadType":"str","repeat":"","crontab":"","once":true,"onceDelay":0.1,"x":150,"y":340,"wires":[["51dd8974.23fe18"]]},{"id":"1d2b2d64.63418b","type":"ui_template","z":"5c66fca0.b4e21c","group":"a1a4b9da.737a38","name":"Bubble (dynamic)","order":2,"width":"8","height":"8","format":"this will be ignored","storeOutMessages":false,"fwdInMessages":true,"templateScope":"local","x":170,"y":280,"wires":[["d19083e3.c4e8f8"]]},{"id":"115e414a.fe70ef","type":"ui_text","z":"5c66fca0.b4e21c","group":"a1a4b9da.737a38","order":1,"width":"8","height":"3","name":"demo 2 description","label":"","format":"{{msg.payload}}","layout":"col-center","x":510,"y":340,"wires":[]},{"id":"ddeb2adc.cfc13","type":"comment","z":"35e1e32f.937e74","name":"Static Bubble chart with 15 points per dataset","info":"","x":230,"y":40,"wires":[]},{"id":"467429fe.4d4f98","type":"ui_text","z":"ed34b63.0ee70c8","group":"ed68b86d.026b2","order":1,"width":"8","height":"3","name":"demo 3 description","label":"","format":"{{msg.payload}}","layout":"col-center","x":510,"y":340,"wires":[]}] |