Last active
May 2, 2022 00:02
-
-
Save karussell/0720b3d3b297621c8bb10cf8c86b2906 to your computer and use it in GitHub Desktop.
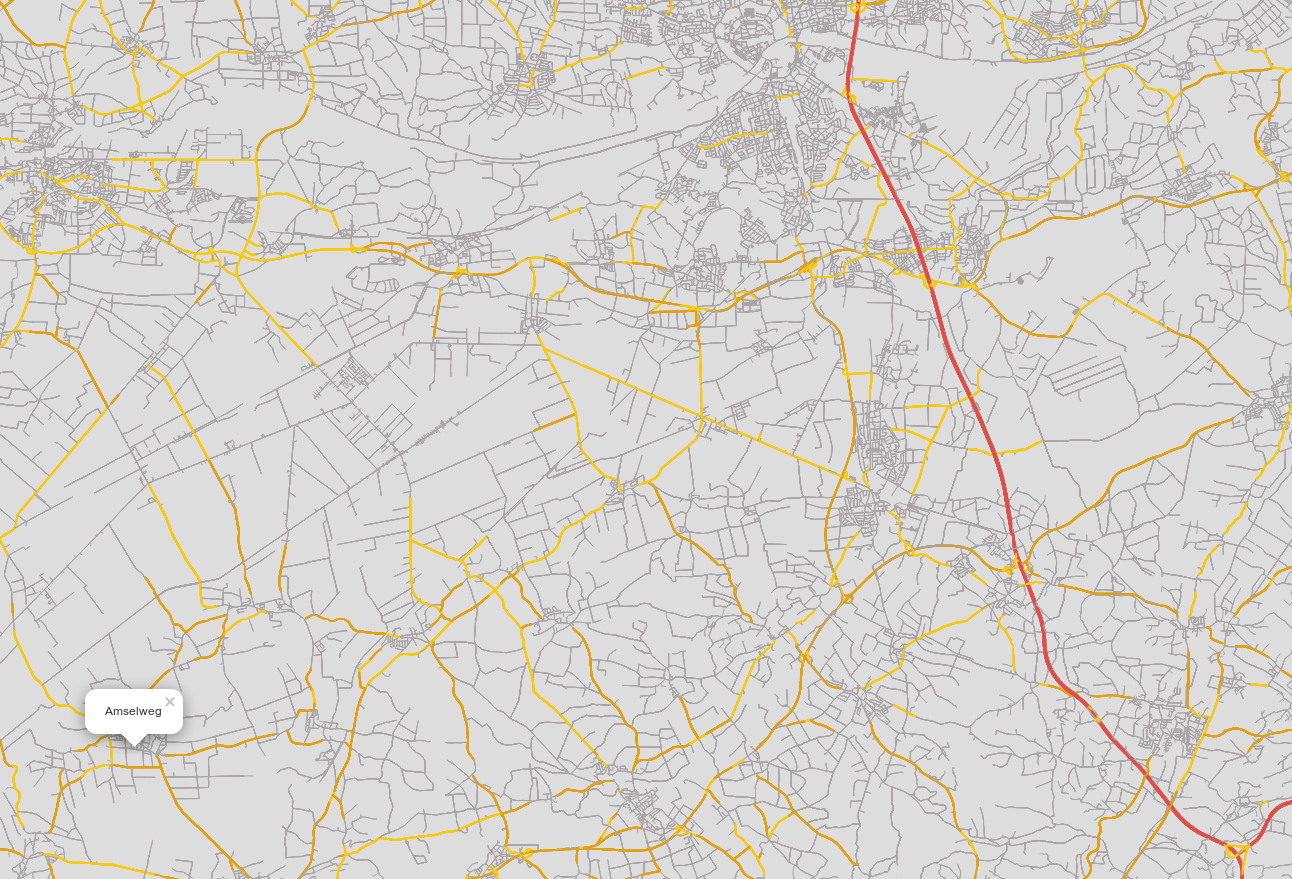
Test UI to show roads from GraphHopper vector tiles endpoint https://github.com/graphhopper/graphhopper/tree/experimental-mvt
This file contains bidirectional Unicode text that may be interpreted or compiled differently than what appears below. To review, open the file in an editor that reveals hidden Unicode characters.
Learn more about bidirectional Unicode characters
| <!DOCTYPE html> | |
| <html> | |
| <head> | |
| <title>Leaflet.VectorGrid Points Example</title> | |
| <meta charset="utf-8"/> | |
| <meta name="viewport" content="width=device-width, initial-scale=1.0"> | |
| <link rel="stylesheet" href="https://unpkg.com/leaflet@1.4.0/dist/leaflet.css"/> | |
| </head> | |
| <body style='margin:0'> | |
| <div id="map" style="width: 100vw; height: 100vh"></div> | |
| <script type="text/javascript" src="https://unpkg.com/leaflet@1.4.0/dist/leaflet.js"></script> | |
| <script type="text/javascript" src="https://unpkg.com/leaflet.vectorgrid@1.3.0"></script> | |
| <script> | |
| var map = L.map('map'); | |
| var vectorTileOptions = { | |
| rendererFactory: L.canvas.tile, | |
| maxNativeZoom: 16, | |
| minNativeZoom: 10, | |
| vectorTileLayerStyles: { | |
| 'roads': function(properties, zoom) { | |
| var color, opacity = 1, weight = 1, radius = 1, s = properties.speed; | |
| if(s >= 100) { | |
| color = '#dd504b'; // red | |
| weight = 3; | |
| radius = 4; | |
| } else if(s >= 80) { | |
| color = '#e2a012'; // orange | |
| weight = 2; | |
| radius = 4; | |
| } else if(s >= 50) { | |
| weight = 2; | |
| color = '#f7c913'; // yellow | |
| } else { | |
| if(zoom <= 11) { | |
| // color = "white"; | |
| color = "#aaa5a7" | |
| opacity = 0.2; | |
| } else { | |
| color = "#aaa5a7"; /* gray */ | |
| } | |
| } | |
| return { | |
| weight: weight, | |
| color: color, | |
| opacity: opacity, | |
| radius: radius | |
| } | |
| }, | |
| }, | |
| interactive: true // Make sure that this VectorGrid fires mouse/pointer events | |
| }; | |
| //L.tileLayer('http://tile.openstreetmap.org/{z}/{x}/{y}.png').addTo(map); | |
| L.vectorGrid.protobuf("http://localhost:8989/mvt/?z={z}&x={x}&y={y}", vectorTileOptions) | |
| .on('click', function(e) { // The .on method attaches an event handler | |
| L.popup() | |
| .setContent(e.layer.properties.name) | |
| // .setContent(JSON.stringify(e.layer)) | |
| .setLatLng(e.latlng) | |
| .openOn(map); | |
| clearHighlight(); | |
| highlight = e.layer.properties.osm_id; | |
| pbfLayer.setFeatureStyle(highlight, { | |
| weight: 2, | |
| color: 'red', | |
| opacity: 1, | |
| fillColor: 'red', | |
| fill: true, | |
| radius: 6, | |
| fillOpacity: 1 | |
| }) | |
| L.DomEvent.stop(e); | |
| }). | |
| addTo(map); | |
| map.setView([48.886392, 10.821533], 14); | |
| </script> | |
| </body> | |
| </html> |
Author
karussell
commented
Mar 19, 2019
<!DOCTYPE html>
<html>
<head>
    <title>Leaflet.VectorGrid Points Example</title>
    <meta charset="utf-8"/>
    <meta name="viewport" content="width=device-width, initial-scale=1.0">
    <link rel="stylesheet" href="https://unpkg.com/leaflet@1.4.0/dist/leaflet.css"/>
</head>
<body style='margin:0'>

<div id="map" style="width: 100vw; height: 100vh"></div>
<script type="text/javascript" src="https://unpkg.com/leaflet@1.4.0/dist/leaflet.js"></script>
<script type="text/javascript" src="https://unpkg.com/leaflet.vectorgrid@1.3.0"></script>
<script>
    var map = L.map('map');
    var vectorTileOptions = {
        rendererFactory: L.canvas.tile,
        maxNativeZoom: 16,
        minNativeZoom: 5,
        vectorTileLayerStyles: {
            'roads': function(properties, zoom) {
                var color, opacity = 1, weight = 1, radius = 1, s = properties.speed;
                if(s >= 100) {
                    color = '#dd504b'; // red
                    weight = 3;
                    radius = 4;
                } else if(s >= 80) {
                    color = '#e2a012'; // orange
                    weight = 2;
                    radius = 4;
                } else if(s >= 50) {
                    weight = 2;
                    color = '#f7c913'; // yellow
                } else {
                    if(zoom <= 11) {
                        // color = "white";
                        color = "#aaa5a7"
                        opacity = 0.2;
                    } else {
                        color = "#aaa5a7"; /* gray */
                    }
                }

                return {
                    weight: weight,
                    color: color,
                    opacity: opacity,
                    radius: radius
                }
            },
        },
        interactive: true // Make sure that this VectorGrid fires mouse/pointer events
    };

    L.tileLayer('http://tile.openstreetmap.org/{z}/{x}/{y}.png').addTo(map);
    L.vectorGrid.protobuf("http://localhost:8989/mvt/{z}/{x}/{y}.mvt", vectorTileOptions)
    .on('click', function(e) {	// The .on method attaches an event handler
        L.popup()
        .setContent(e.layer.properties.name)
        // 					.setContent(JSON.stringify(e.layer))
        .setLatLng(e.latlng)
        .openOn(map);

        clearHighlight();
        highlight = e.layer.properties.osm_id;
        pbfLayer.setFeatureStyle(highlight, {
            weight: 2,
            color: 'red',
            opacity: 1,
            fillColor: 'red',
            fill: true,
            radius: 6,
            fillOpacity: 1
        })

        L.DomEvent.stop(e);
    }).
    addTo(map);
    map.setView([50.130118391390354,14.372788667678835], 14);

</script>
</body>
</html>
Sign up for free
to join this conversation on GitHub.
Already have an account?
Sign in to comment