Last active
August 2, 2018 09:59
-
-
Save kebman/8b10dde8542784dfe92752ccbcd8d096 to your computer and use it in GitHub Desktop.
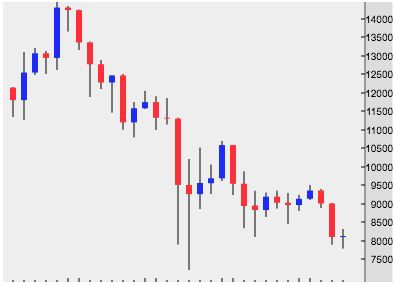
Visualisation of Coinbase Pro market data using JavaScript Canvas
This file contains bidirectional Unicode text that may be interpreted or compiled differently than what appears below. To review, open the file in an editor that reveals hidden Unicode characters.
Learn more about bidirectional Unicode characters
| <!DOCTYPE html> | |
| <html> | |
| <head> | |
| <title>Coinbase Pro Market Data</title> | |
| <meta charset="utf-8"> | |
| <style type="text/css"></style> | |
| </head> | |
| <body> | |
| <header> | |
| <h1>Coinbase Pro Market Data</h1> | |
| <p>Daily chart for January 2018</p> | |
| </header> | |
| <section> | |
| <article> | |
| <h1>Candlestick</h1> | |
| <canvas id="candlestick" height="280" width="390"></canvas> | |
| </article> | |
| <article> | |
| <h1>OHLC</h1> | |
| <canvas id="ohlc" height="280" width="390"></canvas> | |
| </article> | |
| </section> | |
| <footer></footer> | |
| </body> | |
| </html> | |
| <script type="text/javascript"> | |
| // get the canvases | |
| const candlestick = document.getElementById("candlestick"); | |
| const ohlc = document.getElementById("ohlc"); | |
| // load the canvas API | |
| const ctx = candlestick.getContext("2d"); | |
| const bar = ohlc.getContext("2d"); | |
| // make nice grey canvas background... | |
| candlestick.style.backgroundColor = "#eee"; | |
| ohlc.style.backgroundColor = "#eee"; | |
| // show mouse crosshairs instead of arrow | |
| candlestick.style.cursor = "crosshair"; | |
| ohlc.style.cursor = "crosshair"; | |
| // some test data from the API | |
| // [ [ time, low, high, open, close, volume ], ... ]: | |
| const data = [[1517356800,7800,8320.56,8102.86,8130.3,2987.4939951710126],[1517270400,7905.52,9015,9009.92,8105.18,4967.197361042053],[1517184000,8900,9393.23,9360.01,9009.92,1941.3967412897634],[1517097600,9113.54,9495,9137.42,9360.01,1682.0338084398297],[1517011200,8810.57,9241.35,8967.36,9137.41,1938.4323906598265],[1516924800,8456.01,9294,9030.51,8967.35,3507.018808770691],[1516838400,8880,9351,9193.52,9030.51,2161.252532849848],[1516752000,8650,9299.56,8831.86,9193.5,2416.3595867001923],[1516665600,8111,9350,8955.07,8831.86,4124.409844221053],[1516579200,8345.01,9870,9542.49,8941.88,4979.718016722454],[1516492800,9250,10585.61,10585.6,9542.49,3167.723395010765],[1516406400,9619.87,10697.95,9690,10585.6,3105.966977390562],[1516320000,9265,10057.14,9556.12,9690,2787.0859403704353],[1516233600,8860,10514.82,9262,9562.28,6824.137716264857],[1516147200,7221,10210,9510.26,9262,15646.926092453223],[1516060800,7909.57,11321.6,11301.8,9510.25,13010.486329723233],[1515974400,11150,11845,11323.87,11301.8,2563.4019158602837],[1515888000,11000,11895.27,11745.48,11323.88,1913.7552361597225],[1515801600,11571.87,12048.98,11581.03,11745.48,1838.6106011797635],[1515715200,10800,11750,11199.99,11581.03,2659.6168594705337],[1515628800,11011,12500,12465.2,11199.98,4917.044383722514],[1515542400,11471.18,12465.2,12276.25,12465.19,4831.149418542589],[1515456000,12100,12883,12769,12276.25,3254.2394119810015],[1515369600,11888,13374.64,13360.31,12769,4870.544413843281],[1515283200,13160.01,14240,14230,13358.06,2264.7023802601116],[1515196800,13659,14333.87,14299.99,14229.99,2234.372315159909],[1515110400,12624.86,14450,12940,14300,4376.089497412185],[1515024000,12512,13125,13065.05,12940,3391.6497024712885],[1514937600,12493.59,13198,12545.01,13065.62,3506.504651171911],[1514851200,11280,13100,11799.98,12545.01,4707.002371342507],[1514764800,11351,12141,12139.01,11799.98,1923.3512929497529]]; | |
| data.reverse(); // because it starts with the latest date, and ends with the earliest | |
| /* | |
| // alternatively skip .reverse() and just run this for speed: | |
| for (var i = data.length - 1; i >= 0; i--) { | |
| data[i] | |
| } | |
| */ | |
| /* | |
| // get some background data | |
| const ts = data.map(x => x[0]); | |
| const low = data.map(x => x[1]); | |
| const high = data.map(x => x[2]); | |
| const open = data.map(x => x[3]); | |
| const close = data.map(x => x[4]); | |
| const vol = data.map(x => x[5]); | |
| // find max | |
| console.log(Math.max.apply(Math, low)); // 13659 | |
| console.log(Math.max.apply(Math, high)); // 14450 | |
| console.log(Math.max.apply(Math, open)); // 14299.99 | |
| console.log(Math.max.apply(Math, close)); // 14300 | |
| // find min | |
| console.log(Math.min.apply(Math, low)); // 7221 | |
| console.log(Math.min.apply(Math, high)); // 8320.56 | |
| console.log(Math.min.apply(Math, open)); // 8102.86 | |
| console.log(Math.min.apply(Math, close)); // 8105.18 | |
| */ | |
| /* | |
| // min-max | |
| high: 8320.56 - 14450 | |
| low: 7221 - 13659 | |
| open: 8102.86 - 14299.99 | |
| close: 8105.18 - 14300 | |
| min: 7221 | |
| max: 14450 | |
| // normalisation calculations | |
| 14450 - 7800 = 6650 | |
| 6650 / 240 = 27.7083333 | |
| 6650 / 27.7083333 = 240 | |
| 1 / 27.7083333 = 0.0360902256 | |
| 31 / 320 = 0.096875 | |
| 320 / 31 = 10.3225806 | |
| */ | |
| const min = Math.round(7221/1000)*1000; | |
| const max = Math.round(14450/1000)*1000; | |
| // candlestick price plate | |
| ctx.save(); | |
| ctx.beginPath(); | |
| ctx.fillStyle = "#ddd"; | |
| ctx.fillRect(candlestick.width-29,0,28,candlestick.height); | |
| ctx.restore(); | |
| // candlestick price plate spacer | |
| ctx.save(); | |
| ctx.beginPath(); | |
| ctx.strokeStyle="#555"; | |
| ctx.moveTo(candlestick.width-28, 0); | |
| ctx.lineTo(candlestick.width-28, candlestick.height); | |
| ctx.stroke(); | |
| ctx.restore(); | |
| // ohlc price plate | |
| bar.save(); | |
| bar.beginPath(); | |
| bar.fillStyle = "#ddd"; | |
| bar.fillRect(candlestick.width-29,0,28,candlestick.height); | |
| bar.restore(); | |
| // ohlc price plate spacer | |
| bar.save(); | |
| bar.beginPath(); | |
| bar.strokeStyle="#555"; | |
| bar.moveTo(candlestick.width-28, 0); | |
| bar.lineTo(candlestick.width-28, candlestick.height); | |
| bar.stroke(); | |
| bar.restore(); | |
| // pricetags on price plate - split by 500 | |
| for (var i = max; i >= 0; i-=500) { | |
| // normalisation | |
| let step = Math.round(((14450-i) / 27)*1)/1; | |
| // candlestick pricetags | |
| ctx.beginPath(); | |
| ctx.moveTo(candlestick.width-28, step); | |
| ctx.lineTo(candlestick.width-32, step); | |
| ctx.stroke(); | |
| ctx.font = "10px Arial"; | |
| ctx.textAlign = "right"; | |
| ctx.fillText(i,candlestick.width,step+4); | |
| // ohlc pricetags | |
| bar.beginPath(); | |
| bar.moveTo(candlestick.width-28, step); | |
| bar.lineTo(candlestick.width-32, step); | |
| bar.stroke(); | |
| bar.font = "10px Arial"; | |
| bar.textAlign = "right"; | |
| bar.fillText(i,candlestick.width,step+4); | |
| // cutoff because we don't need all of them | |
| if (i <= min+500) { | |
| break; | |
| } | |
| } | |
| // function for normalising the data to the canvas height | |
| function nrmlz(candle, id) { | |
| return ((14450 - candle[id]) / 27) // 27.7083333 | |
| } | |
| let day = new Date(); // to detect weekend | |
| let x = 10; | |
| data.forEach((candle) => { | |
| // low, high line | |
| ctx.beginPath(); | |
| ctx.moveTo(x, nrmlz(candle, 2)); | |
| ctx.lineTo(x, nrmlz(candle, 1)); | |
| ctx.stroke(); | |
| // open close line | |
| /* | |
| ctx.beginPath(); | |
| ctx.moveTo(x, nrmlz(candle, 4)); | |
| ctx.lineTo(x, nrmlz(candle, 3)); | |
| ctx.stroke(); | |
| */ | |
| // a nice selection of reds, blues and greens... | |
| const red = ["#801515", "#d46a6a", "#aa3939","#ff3333"]; | |
| const blue = ["#261758","#615192","#28285b","#3e3e73", "#4949b5","#1a1aff"]; | |
| const green = ["#7b9f35"]; | |
| // open, close rectangle candlestick body | |
| ctx.beginPath(); | |
| ctx.rect(x-3,nrmlz(candle, 4), 6, nrmlz(candle, 3)-nrmlz(candle, 4)) | |
| // check if bearish or bullish candle | |
| if (nrmlz(candle, 3)<nrmlz(candle, 4)) { | |
| ctx.fillStyle = red[3]; | |
| } else { | |
| ctx.fillStyle = blue[5]; | |
| } | |
| ctx.fill(); | |
| // open, close OHLC chart | |
| bar.beginPath(); | |
| bar.rect(x,nrmlz(candle, 4), 5, 1) | |
| bar.fillStyle = "black"; | |
| bar.fill(); | |
| bar.beginPath(); | |
| bar.rect(x-4,nrmlz(candle, 3), 5, 1) | |
| bar.fillStyle = "black"; | |
| bar.fill(); | |
| // low, high line | |
| bar.beginPath(); | |
| bar.moveTo(x, nrmlz(candle, 2)); | |
| bar.lineTo(x, nrmlz(candle, 1)); | |
| bar.stroke(); | |
| // candlestick timeline | |
| ctx.beginPath(); | |
| ctx.moveTo(x, candlestick.height); | |
| // detect weekend | |
| day.setTime(candle[0]*1000); | |
| if (day.getDay() == 6 || day.getDay() == 0) { | |
| ctx.lineTo(x, candlestick.height-4); | |
| } else { | |
| ctx.lineTo(x, candlestick.height-2); | |
| } | |
| ctx.stroke(); | |
| // ohlc timeline | |
| bar.beginPath(); | |
| bar.moveTo(x, ohlc.height); | |
| // detect weekend | |
| day.setTime(candle[0]*1000); | |
| if (day.getDay() == 6 || day.getDay() == 0) { | |
| bar.lineTo(x, candlestick.height-4); | |
| } else { | |
| bar.lineTo(x, candlestick.height-2); | |
| } | |
| bar.stroke(); | |
| x += 11; // x-axis step, as per width normalisation calc | |
| }); | |
| </script> |
Sign up for free
to join this conversation on GitHub.
Already have an account?
Sign in to comment
Here's an example of what the canvas will print: