QGIS has the ability to style points using SVG symbols, and size and color them by attributes of the points.
SVG is a file format that means Scalable Vector Graphics. Because they are a vector format, they can easily be sized without losing detail or becoming pixelated (as can happen with raster icons).
Free or public domain SVG files can be found on the web. For example, here is a collection of paint splatters: https://svgsilh.com/tag/splatter-1.html
SVG files are actually text files that can be viewed in any text editor. Many SVGs are solid black; if you want to be able to color them in QGIS you'll want to edit the SVG and change fill="#000000" to fill="param(fill)" -- this has already been done for splatter1.svg -- click the "raw" button below to see the SVG code.
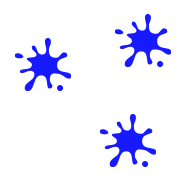
Below is a sample point file called points.geojson. Load it into QGIS. First, we'll style it with a generic splatter symbol.
- Open the Layer Styling panel
- Click "Simple marker"
- Change "Symbol layer type" from "Simple marker" to "SVG marker"
- Scroll down, past the built-in SVG Groups and click '...' to select the splatter1.svg file
The markers are probably to small to see, so scroll back up, above the fill color and set:
- Width = 15 (millimeters)
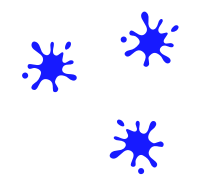
Notice that the splatters look way to similar, so we'll apply some random rotation:
- Next to the "Rotation" input, cilck the icon on the right (for data-defined override) > Edit
- Enter the expression
rand(0,360)
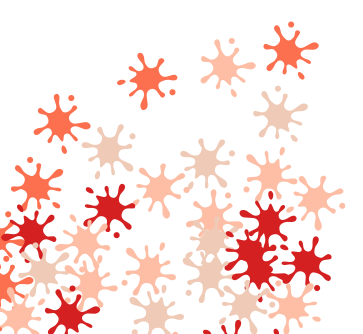
Let's style the symbols by the population:
- At the top of the Layer Styling panel, change "Single Symbol" to "Graduated"
- Value = POP2000
- Click the "Classify" button near the bottom
This creates several classes based on the values of the POP2000 column. You can change the classification mode (the default is quantiles) or the number of classes.
If you have trouble changing the color of the splatters, see the note above about setting fill="param(fill)" in the SVG file.
If we want to change the size, rather than the color, above the list of classes, set:
- Method = Size
- Size from = 5.0 to 15.0

If you want to control both size and color from different attributes, it's usually easiest to set the color with a graduated style, then use a data-defined override for the size.
If you want to get really fancy, you could even use several different SVG files, and pick a random one by using a data-defined override expression like:
'D:/path_to_project/splatter' || rand(1,3) || '.svg'
This will randomly select the splatter1.svg, splatter2.svg, or splatter3.svg file.