Last active
August 15, 2023 18:54
-
-
Save ktsaou/df6556f0702f5263a3f82f6cfd9f5f30 to your computer and use it in GitHub Desktop.
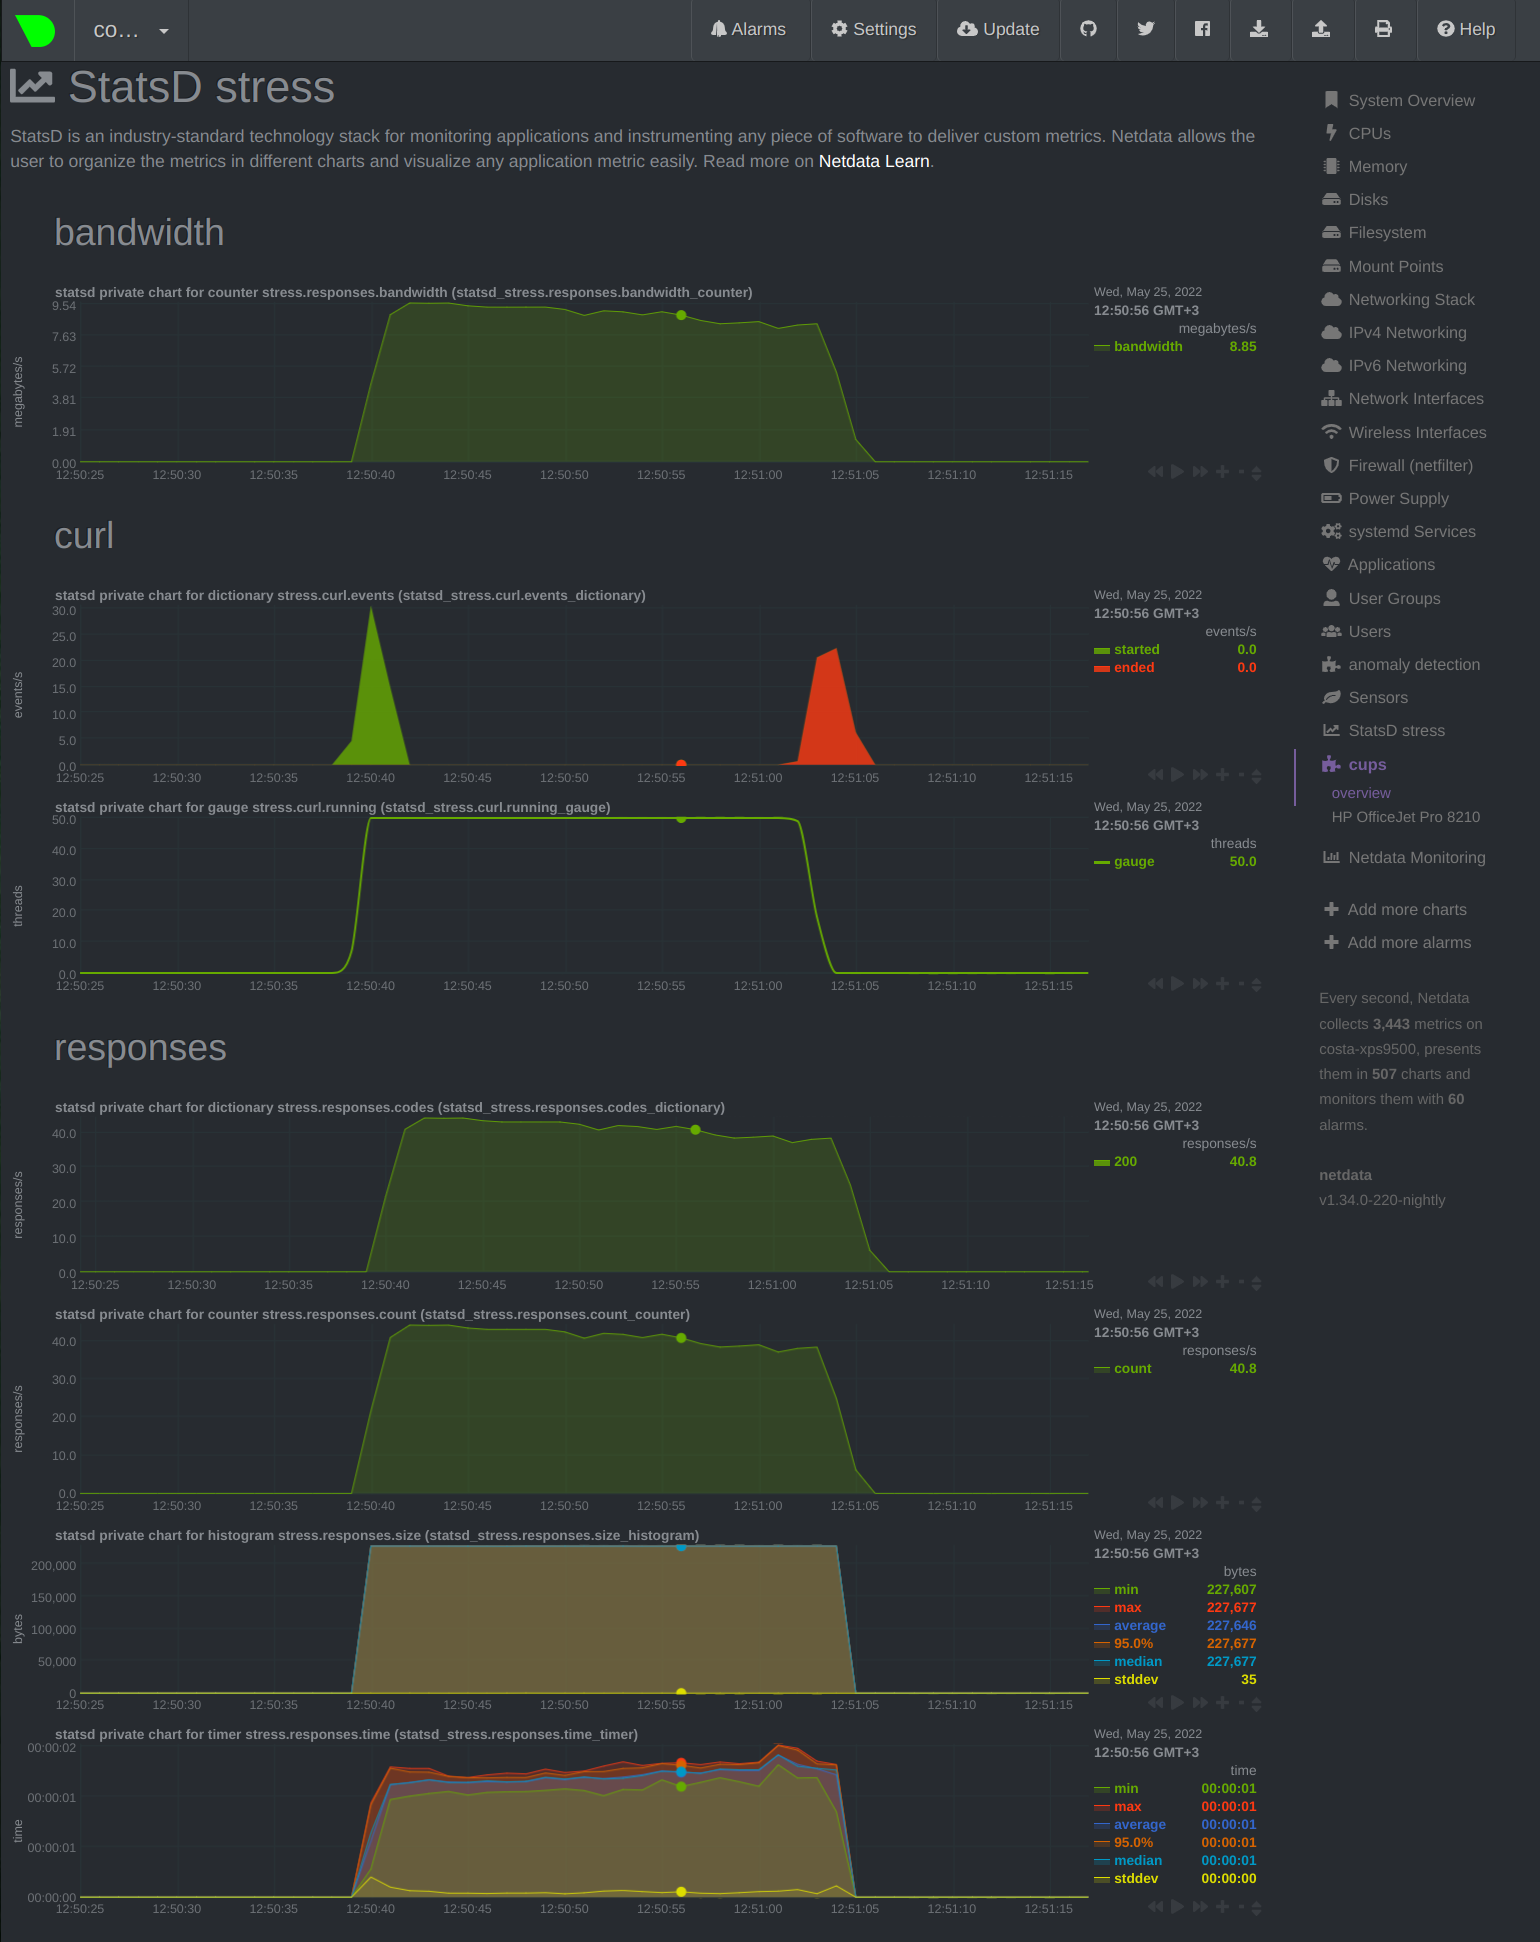
Command line web server stress testing tool, implemented with curl and real-time statistics to netdata
This file contains bidirectional Unicode text that may be interpreted or compiled differently than what appears below. To review, open the file in an editor that reveals hidden Unicode characters.
Learn more about bidirectional Unicode characters
| #!/usr/bin/env bash | |
| # Stress With Curl | |
| # Run multiple curl worker to stress a web server | |
| # Real-time statistics at a Netdata server | |
| # | |
| # To use, you need: | |
| # - curl | |
| # - The nc command from the openbsd-netcat package | |
| # - Netdata | |
| # Ignore locale for numbers parsing | |
| LC_ALL=C | |
| # Our name | |
| me="$(basename ${0})" | |
| # give a statsd name, based on our script name | |
| # so that renaming the script, will provide different | |
| # dashboard sections at netdata | |
| STATSD_NAME="${me,,}" # convert ${me} to lowercase | |
| STATSD_NAME="${STATSD_NAME%%.sh}" # remove .sh suffix if present | |
| STATSD_NAME="${STATSD_NAME//[^[:alnum:]]}" # keep only alphanumeric characters | |
| STATSD_SERVER="localhost" # all netdata have statsd | |
| STATSD_PORT=8125 # we use TCP/8125 | |
| STATSD_TIMEOUT=600 | |
| NETDATA_PORT=19999 | |
| # defaults | |
| CONNECTIONS=1 | |
| QUERIES=1 | |
| # ----------------------------------------------------------------------------- | |
| # command line parsing | |
| usage() { | |
| cat <<USAGE_EOF | |
| USAGE: | |
| ${me} options URL | |
| options can be: | |
| -q, --queries QUERIES | |
| The total number of queries to make. | |
| default: ${QUERIES} | |
| -c, --connections CONNECTIONS | |
| How many concurrent connections to make. | |
| We will spawn that many curl commands. | |
| default: ${CONNECTIONS} | |
| -n, --name STATSD_NAME | |
| The name on statsd metrics. | |
| Change the name if you plan to run multiple | |
| tests concurrently, so that you can have | |
| a separate section at Netdata for each instance. | |
| One word, alphanumeric lowercase only. | |
| default: ${STATSD_NAME} | |
| URL | |
| The URL to hit. | |
| USAGE_EOF | |
| exit 1 | |
| } | |
| while [ ! -z "${1}" ]; do | |
| case "${1}" in | |
| -c|--connections) | |
| CONNECTIONS="$[ $2 + 0 ]" | |
| echo >&2 "CONNECTIONS set to ${CONNECTIONS}" | |
| shift 2 | |
| ;; | |
| -q|--queries) | |
| QUERIES="$[ $2 + 0 ]" | |
| echo >&2 "QUERIES set to ${QUERIES}" | |
| shift 2 | |
| ;; | |
| -n|--name) | |
| STATSD_NAME="${2,,}" | |
| STATSD_NAME="${STATSD_NAME//[^[:alnum:]]}" | |
| echo >&2 "STATSD_NAME set to '${STATSD_NAME}'" | |
| shift 2 | |
| ;; | |
| -h|--help) | |
| usage | |
| ;; | |
| *) | |
| URL="${1}" | |
| echo >&2 "URL set to '${URL}'" | |
| shift | |
| ;; | |
| esac | |
| done | |
| # ----------------------------------------------------------------------------- | |
| # sanity checks on command line parameters | |
| [ -z "${URL}" ] && echo >&2 "You have to give a URL" && usage | |
| [ ${QUERIES} -lt 1 ] && echo >&2 "You have to give a valid queries number" && usage | |
| [ ${CONNECTIONS} -lt 1 ] && echo >&2 "You have to give a valid connections number" && usage | |
| # ----------------------------------------------------------------------------- | |
| # check if statsd is running | |
| nc -w 0 ${STATSD_SERVER} ${STATSD_PORT} | |
| if [ $? -ne 0 ]; then | |
| echo >&2 "StatsD on TCP ${STATSD_SERVER}:${STATSD_PORT} is not running. Aborting." | |
| echo >&2 "You need openbsd-netcat and Netdata for this script to work." | |
| exit 1 | |
| fi | |
| # ----------------------------------------------------------------------------- | |
| # check if netdata is running | |
| nc -w 0 ${STATSD_SERVER} ${NETDATA_PORT} | |
| if [ $? -ne 0 ]; then | |
| echo >&2 "Netdata on TCP ${STATSD_SERVER}:${NETDATA_PORT} is not running. Aborting." | |
| echo >&2 "You need openbsd-netcat and Netdata for this script to work." | |
| exit 1 | |
| fi | |
| # ----------------------------------------------------------------------------- | |
| # initialize statsd metrics | |
| echo >&2 "Statsd metrics to ${STATSD_SERVER}:${STATSD_PORT}, as '${STATSD_NAME}'..." | |
| # our statsd metric names | |
| STATSD_RESPONSES_COUNT="${STATSD_NAME}.responses.count" | |
| STATSD_RESPONSES_CODES="${STATSD_NAME}.responses.codes" | |
| STATSD_RESPONSES_BANDWIDTH="${STATSD_NAME}.responses.bandwidth" | |
| STATSD_RESPONSES_TIME="${STATSD_NAME}.responses.time" | |
| STATSD_RESPONSES_SIZE="${STATSD_NAME}.responses.size" | |
| STATSD_CURL_EVENTS="${STATSD_NAME}.curl.events" | |
| STATSD_CURL_RUNNING="${STATSD_NAME}.curl.running" | |
| # initialize netdata charts | |
| # 'zinit' is a special value that does nothing apart from initializing the charts | |
| # it allows netdata to collect units and names for the charts | |
| # so that we don't need to push them on every metric | |
| nc -u -w 0 localhost 8125 <<STATSD_EOF | |
| ${STATSD_RESPONSES_COUNT}:zinit|c|#units:responses/s,name:count,family:responses | |
| ${STATSD_RESPONSES_CODES}:zinit|d|#units:responses/s,family:responses | |
| ${STATSD_RESPONSES_BANDWIDTH}:zinit|c|#units:bytes/s,name:bandwidth,family:bandwidth | |
| ${STATSD_RESPONSES_SIZE}:zinit|h|#units:bytes,family:responses | |
| ${STATSD_RESPONSES_TIME}:zinit|ms|#units:seconds,family:responses | |
| ${STATSD_CURL_EVENTS}:zinit|d|#units:events/s,family:curl | |
| ${STATSD_CURL_RUNNING}:0|g|#units:threads,name:commands,family:curl | |
| STATSD_EOF | |
| # ----------------------------------------------------------------------------- | |
| # cleanup temp files | |
| tmpdir=$(mktemp -d "/tmp/stress-with-curl-XXXXXX") | |
| tmpfile="${tmpdir}/config" | |
| cleanup() { | |
| # remove temporary files we created | |
| rm -rf ${tmpdir} | |
| # reset the running threads to zero | |
| # this is needed in case the user presses control-c | |
| # while the test is running | |
| echo "${STATSD_CURL_RUNNING}:0|g|#units:threads,name:commands,family:curl" | nc -u -w 0 localhost 8125 | |
| } | |
| trap cleanup EXIT | |
| # ----------------------------------------------------------------------------- | |
| # find out how many queries (CURL_QUERIES) and restarts (CURL_RERUNS) | |
| # we should do per curl thread | |
| # find out how many URLs each thread should hit to | |
| # fullfil the total number of requests. | |
| curl_max_queries=200 | |
| CURL_RERUNS=$[QUERIES / CONNECTIONS / curl_max_queries] | |
| [ ${CURL_RERUNS} -lt 1 ] && CURL_RERUNS=1 | |
| CURL_QUERIES=$[QUERIES / CONNECTIONS / CURL_RERUNS] | |
| [ ${CURL_QUERIES} -lt 1 ] && CURL_QUERIES=1 | |
| [ ${CURL_QUERIES} -gt ${curl_max_queries} ] && CURL_RERUNS=$[CURL_RERUNS + 1] | |
| CURL_QUERIES=$[QUERIES / CONNECTIONS / CURL_RERUNS] | |
| # So, the total queries may be a little different to what we have been asked for | |
| QUERIES=$[CURL_QUERIES * CONNECTIONS * CURL_RERUNS] | |
| # ----------------------------------------------------------------------------- | |
| # Generate the curl config gile | |
| # Adding the header 'Accept-encoding: gzip' to curl, makes curl receive compressed data | |
| # but prevents it from uncompressing it (option 'compressed' does the same, but curl will | |
| # uncompress the data upon reception, which is CPU consuming and we want to avoid it). | |
| # Adding the header "Connection: keep-alive" will make curl reuse existing connections | |
| # but the last few requests will not be executed by multiple workers, so there will be a | |
| # "slow tail" of requests. | |
| cat >>${tmpfile}.1 <<CURL_CONF_EOF | |
| raw | |
| no-buffer | |
| location | |
| retry = 0 | |
| output = "/dev/null" | |
| header = "Accept-encoding: gzip" | |
| write-out = "${STATSD_RESPONSES_COUNT}:+1|c\n${STATSD_RESPONSES_CODES}:%{http_code}|d\n${STATSD_RESPONSES_BANDWIDTH}:+%{size_download}|c\n${STATSD_RESPONSES_SIZE}:%{size_download}|h\n${STATSD_RESPONSES_TIME}:%{time_total}|ms\n" | |
| url = "${URL}" | |
| CURL_CONF_EOF | |
| # create a file of that many entries, as fast as possible | |
| # so, we start with 1 and double it every time | |
| wanted=${CURL_QUERIES} | |
| while [ ${wanted} -gt 0 ]; do | |
| tmp=1 | |
| cp ${tmpfile}.1 ${tmpfile}.tmp | |
| while [ $[tmp * 2] -le ${wanted} ]; do | |
| cp ${tmpfile}.tmp ${tmpfile}.new | |
| cat ${tmpfile}.new >>${tmpfile}.tmp | |
| tmp=$[tmp * 2] | |
| done | |
| cat ${tmpfile}.tmp >>${tmpfile} | |
| wanted=$[wanted - tmp] | |
| done | |
| # ----------------------------------------------------------------------------- | |
| # print a summary of what we will do | |
| echo >&2 | |
| echo >&2 "Will do a total of ${QUERIES} queries." | |
| echo >&2 "With ${CONNECTIONS} curl commands running in parallel." | |
| echo >&2 "Each will run ${CURL_QUERIES} queries, and restart to repeat $[CURL_RERUNS - 1] times." | |
| echo >&2 "To: '${URL}'" | |
| echo >&2 | |
| # ----------------------------------------------------------------------------- | |
| # spawn as many curl commands as needed for the concurrent connections | |
| do_curl() { | |
| local i=${CURL_RERUNS} | |
| while [ $i -gt 0 ]; do | |
| i=$[ i - 1 ] | |
| echo "${STATSD_NAME}.curl.events:started|d" | |
| echo "${STATSD_NAME}.curl.running:+1|g" | |
| stdbuf -i0 -oL -eL curl -s -S --fail-early --config ${tmpfile} | |
| echo "${STATSD_NAME}.curl.events:ended|d" | |
| echo "${STATSD_NAME}.curl.running:-1|g" | |
| done |\ | |
| stdbuf -i0 -oL -eL nc -N -w ${STATSD_TIMEOUT} ${STATSD_SERVER} ${STATSD_PORT} | |
| } | |
| printf >&2 "Spawning curls : " | |
| start_t=$(date +%s%3N) | |
| start_epoch=${start_t:0:10} | |
| x=${CONNECTIONS} | |
| pidlist=() | |
| while [ $x -gt 0 ]; do | |
| x=$[ x - 1 ] | |
| printf "." | |
| do_curl & pidlist+=( "$!" ) | |
| done | |
| echo >&2 " started ${#pidlist[@]} curls" | |
| # ----------------------------------------------------------------------------- | |
| # Let the user know we are doing it | |
| echo >&2 | |
| echo >&2 "The server is under siege now..." | |
| echo >&2 "(Check Netdata server at ${STATSD_SERVER} for real-time progress metrics)" | |
| echo >&2 | |
| # ----------------------------------------------------------------------------- | |
| # wait for curls to finish | |
| printf >&2 "Waiting for curls to finish: " | |
| failed=0 | |
| while [ ${#pidlist[@]} -gt 0 ]; do | |
| exitlist= | |
| wait -p exitlist -n "${pidlist[@]}" | |
| ret=$? | |
| [ -z "${exitlist}" ] && echo >&2 "Invalid exitlist. Aborting." && exit 1 | |
| [ $ret -eq 127 ] && echo >&2 "Invalid pidlist. Aborting." && exit 1 | |
| [ $ret -eq 0 ] && printf "." | |
| [ $ret -ne 0 ] && printf "x" && failed=$[failed + 1] | |
| i=0; | |
| while [ $i -lt ${#pidlist[@]} ]; do | |
| [ "${pidlist[$i]}" -eq "${exitlist}" ] && unset pidlist[$i] && break | |
| i=$[ i + 1 ] | |
| done | |
| # we have to re-index the array - now it has a hole in it | |
| pidlist=( "${pidlist[@]}" ) | |
| done | |
| echo >&2 | |
| end_t=$(date +%s%3N) | |
| end_epoch=${end_t:0:10} | |
| end_epoch=$[end_epoch + 2] # +1 to roundup, +1 for statsd to flush it | |
| # ----------------------------------------------------------------------------- | |
| # print our own statistics | |
| dt=$[ end_t - start_t ] | |
| secs=$[ dt / 1000 ] | |
| ms=$[ dt - (secs * 1000) ] | |
| cat <<EOF1 | |
| Summary | |
| Requests made : ${QUERIES} | |
| Threads : ${CONNECTIONS} (failed $failed) | |
| Time passed : ${secs}s.${ms}ms | |
| Rate : $(echo "scale=2; ${QUERIES} / ${dt} * 60.0" | bc -l) reqs/s | |
| EOF1 | |
| # ----------------------------------------------------------------------------- | |
| # collect metrics from Netdata | |
| count_netdata_points() { | |
| local numbers=( $(curl -s -S "http://${STATSD_SERVER}:${NETDATA_PORT}/api/v1/data?chart=statsd_${STATSD_RESPONSES_COUNT}_counter&before=${end_epoch}&after=${start_epoch}&points=$[end_epoch - start_epoch + 1]&options=unaligned&group=sum&format=ssv") ) | |
| # declare -p numbers >&2 | |
| echo ${#numbers[@]} | |
| } | |
| count_netdata_responses() { | |
| printf "%0.0Lf\n" $(curl -s -S "http://${STATSD_SERVER}:${NETDATA_PORT}/api/v1/data?chart=statsd_${STATSD_RESPONSES_COUNT}_counter&before=${end_epoch}&after=${start_epoch}&points=1&options=unaligned&group=sum&format=ssv") | |
| } | |
| max_wait=20 # this is max loops to do waiting for netdata to flush its metrics | |
| while [ \( $(count_netdata_responses) -lt ${QUERIES} -o $(count_netdata_points) -lt $[end_epoch - start_epoch] \) -a ${max_wait} -gt 0 ] | |
| do | |
| max_wait=$[max_wait - 1] | |
| printf "." >&2 | |
| sleep 0.25 | |
| done | |
| echo >&2 | |
| responses=$(curl -s -S "http://${STATSD_SERVER}:${NETDATA_PORT}/api/v1/data?chart=statsd_${STATSD_RESPONSES_COUNT}_counter&before=${end_epoch}&after=${start_epoch}&points=1&options=unaligned&group=sum&format=ssv") | |
| min_time=$(curl -s -S "http://${STATSD_SERVER}:${NETDATA_PORT}/api/v1/data?chart=statsd_${STATSD_RESPONSES_TIME}_timer&before=${end_epoch}&after=${start_epoch}&points=$[end_epoch - start_epoch + 1]&options=unaligned&group=min&format=ssv&dimensions=min" | tr ' ' '\n' | sort -n | grep -v "^0$" | head -n 1) | |
| max_time=$(curl -s -S "http://${STATSD_SERVER}:${NETDATA_PORT}/api/v1/data?chart=statsd_${STATSD_RESPONSES_TIME}_timer&before=${end_epoch}&after=${start_epoch}&points=1&options=unaligned&group=max&format=ssv&dimensions=max") | |
| bytes=$(curl -s -S "http://${STATSD_SERVER}:${NETDATA_PORT}/api/v1/data?chart=statsd_${STATSD_RESPONSES_BANDWIDTH}_counter&before=${end_epoch}&after=${start_epoch}&points=1&options=unaligned&group=sum&format=ssv") | |
| min_size=$(curl -s -S "http://${STATSD_SERVER}:${NETDATA_PORT}/api/v1/data?chart=statsd_${STATSD_RESPONSES_SIZE}_histogram&before=${end_epoch}&after=${start_epoch}&points=$[end_epoch - start_epoch + 1]&options=unaligned&group=min&format=ssv&dimensions=min" | tr ' ' '\n' | sort -n | grep -v "^0$" | head -n 1) | |
| max_size=$(curl -s -S "http://${STATSD_SERVER}:${NETDATA_PORT}/api/v1/data?chart=statsd_${STATSD_RESPONSES_SIZE}_histogram&before=${end_epoch}&after=${start_epoch}&points=1&options=unaligned&group=max&format=ssv&dimensions=max") | |
| cat <<EOF2 | |
| Netdata StatsD report: | |
| Responses | |
| Total : $(printf "%0.0f" "${responses}") | |
| Data Transferred | |
| Total : $( echo "scale=2; ${bytes} / 1024 / 1024" | bc -l ) MB | |
| Smallest : $(printf "%-6.2f" $(echo "${min_size} / 1024" | bc -l)) KB | |
| Biggest : $(printf "%-6.2f" $(echo "${max_size} / 1024" | bc -l)) KB | |
| Response Timings | |
| Fastest : $(printf "%-6.2f" $(echo "${min_time} * 1000" | bc -l)) ms | |
| Slowest : $(printf "%-6.2f" $(echo "${max_time} * 1000" | bc -l)) ms | |
| EOF2 |
Sign up for free
to join this conversation on GitHub.
Already have an account?
Sign in to comment
Example run:
Netdata dashboard: