-
-
Save linar-jether/95ff412f9d19fdf5e51293eb0c09b850 to your computer and use it in GitHub Desktop.
| from flask import Flask, request, jsonify, json, abort | |
| from flask_cors import CORS, cross_origin | |
| import pandas as pd | |
| app = Flask(__name__) | |
| cors = CORS(app) | |
| app.config['CORS_HEADERS'] = 'Content-Type' | |
| methods = ('GET', 'POST') | |
| metric_finders= {} | |
| metric_readers = {} | |
| annotation_readers = {} | |
| panel_readers = {} | |
| def add_reader(name, reader): | |
| metric_readers[name] = reader | |
| def add_finder(name, finder): | |
| metric_finders[name] = finder | |
| def add_annotation_reader(name, reader): | |
| annotation_readers[name] = reader | |
| def add_panel_reader(name, reader): | |
| panel_readers[name] = reader | |
| @app.route('/', methods=methods) | |
| @cross_origin() | |
| def hello_world(): | |
| print request.headers, request.get_json() | |
| return 'Jether\'s python Grafana datasource, used for rendering HTML panels and timeseries data.' | |
| @app.route('/search', methods=methods) | |
| @cross_origin() | |
| def find_metrics(): | |
| print request.headers, request.get_json() | |
| req = request.get_json() | |
| target = req.get('target', '*') | |
| if ':' in target: | |
| finder, target = target.split(':', 1) | |
| else: | |
| finder = target | |
| if not target or finder not in metric_finders: | |
| metrics = [] | |
| if target == '*': | |
| metrics += metric_finders.keys() + metric_readers.keys() | |
| else: | |
| metrics.append(target) | |
| return jsonify(metrics) | |
| else: | |
| return jsonify(list(metric_finders[finder](target))) | |
| def dataframe_to_response(target, df, freq=None): | |
| response = [] | |
| if df.empty: | |
| return response | |
| if freq is not None: | |
| orig_tz = df.index.tz | |
| df = df.tz_convert('UTC').resample(rule=freq, label='right', closed='right', how='mean').tz_convert(orig_tz) | |
| if isinstance(df, pd.Series): | |
| response.append(_series_to_response(df, target)) | |
| elif isinstance(df, pd.DataFrame): | |
| for col in df: | |
| response.append(_series_to_response(df[col], target)) | |
| else: | |
| abort(404, Exception('Received object is not a dataframe or series.')) | |
| return response | |
| def dataframe_to_json_table(target, df): | |
| response = [] | |
| if df.empty: | |
| return response | |
| if isinstance(df, pd.DataFrame): | |
| response.append({'type': 'table', | |
| 'columns': df.columns.map(lambda col: {"text": col}).tolist(), | |
| 'rows': df.where(pd.notnull(df), None).values.tolist()}) | |
| else: | |
| abort(404, Exception('Received object is not a dataframe.')) | |
| return response | |
| def annotations_to_response(target, df): | |
| response = [] | |
| # Single series with DatetimeIndex and values as text | |
| if isinstance(df, pd.Series): | |
| for timestamp, value in df.iteritems(): | |
| response.append({ | |
| "annotation": target, # The original annotation sent from Grafana. | |
| "time": timestamp.value // 10 ** 6, # Time since UNIX Epoch in milliseconds. (required) | |
| "title": value, # The title for the annotation tooltip. (required) | |
| #"tags": tags, # Tags for the annotation. (optional) | |
| #"text": text # Text for the annotation. (optional) | |
| }) | |
| # Dataframe with annotation text/tags for each entry | |
| elif isinstance(df, pd.DataFrame): | |
| for timestamp, row in df.iterrows(): | |
| annotation = { | |
| "annotation": target, # The original annotation sent from Grafana. | |
| "time": timestamp.value // 10 ** 6, # Time since UNIX Epoch in milliseconds. (required) | |
| "title": row.get('title', ''), # The title for the annotation tooltip. (required) | |
| } | |
| if 'text' in row: | |
| annotation['text'] = str(row.get('text')) | |
| if 'tags' in row: | |
| annotation['tags'] = str(row.get('tags')) | |
| response.append(annotation) | |
| else: | |
| abort(404, Exception('Received object is not a dataframe or series.')) | |
| return response | |
| def _series_to_annotations(df, target): | |
| if df.empty: | |
| return {'target': '%s' % (target), | |
| 'datapoints': []} | |
| sorted_df = df.dropna().sort_index() | |
| timestamps = (sorted_df.index.astype(pd.np.int64) // 10 ** 6).values.tolist() | |
| values = sorted_df.values.tolist() | |
| return {'target': '%s' % (df.name), | |
| 'datapoints': zip(values, timestamps)} | |
| def _series_to_response(df, target): | |
| if df.empty: | |
| return {'target': '%s' % (target), | |
| 'datapoints': []} | |
| sorted_df = df.dropna().sort_index() | |
| try: | |
| timestamps = (sorted_df.index.astype(pd.np.int64) // 10 ** 6).values.tolist() # New pandas version | |
| except: | |
| timestamps = (sorted_df.index.astype(pd.np.int64) // 10 ** 6).tolist() | |
| values = sorted_df.values.tolist() | |
| return {'target': '%s' % (df.name), | |
| 'datapoints': zip(values, timestamps)} | |
| @app.route('/query', methods=methods) | |
| @cross_origin(max_age=600) | |
| def query_metrics(): | |
| print request.headers, request.get_json() | |
| req = request.get_json() | |
| results = [] | |
| ts_range = {'$gt': pd.Timestamp(req['range']['from']).to_pydatetime(), | |
| '$lte': pd.Timestamp(req['range']['to']).to_pydatetime()} | |
| if 'intervalMs' in req: | |
| freq = str(req.get('intervalMs')) + 'ms' | |
| else: | |
| freq = None | |
| for target in req['targets']: | |
| if ':' not in target.get('target', ''): | |
| abort(404, Exception('Target must be of type: <finder>:<metric_query>, got instead: ' + target['target'])) | |
| req_type = target.get('type', 'timeserie') | |
| finder, target = target['target'].split(':', 1) | |
| query_results = metric_readers[finder](target, ts_range) | |
| if req_type == 'table': | |
| results.extend(dataframe_to_json_table(target, query_results)) | |
| else: | |
| results.extend(dataframe_to_response(target, query_results, freq=freq)) | |
| return jsonify(results) | |
| @app.route('/annotations', methods=methods) | |
| @cross_origin(max_age=600) | |
| def query_annotations(): | |
| print request.headers, request.get_json() | |
| req = request.get_json() | |
| results = [] | |
| ts_range = {'$gt': pd.Timestamp(req['range']['from']).to_pydatetime(), | |
| '$lte': pd.Timestamp(req['range']['to']).to_pydatetime()} | |
| query = req['annotation']['query'] | |
| if ':' not in query: | |
| abort(404, Exception('Target must be of type: <finder>:<metric_query>, got instead: ' + query)) | |
| finder, target = query.split(':', 1) | |
| results.extend(annotations_to_response(query, annotation_readers[finder](target, ts_range))) | |
| return jsonify(results) | |
| @app.route('/panels', methods=methods) | |
| @cross_origin() | |
| def get_panel(): | |
| print request.headers, request.get_json() | |
| req = request.args | |
| ts_range = {'$gt': pd.Timestamp(int(req['from']), unit='ms').to_pydatetime(), | |
| '$lte': pd.Timestamp(int(req['to']), unit='ms').to_pydatetime()} | |
| query = req['query'] | |
| if ':' not in query: | |
| abort(404, Exception('Target must be of type: <finder>:<metric_query>, got instead: ' + query)) | |
| finder, target = query.split(':', 1) | |
| return panel_readers[finder](target, ts_range) | |
| if __name__ == '__main__': | |
| # Sample annotation reader : add_annotation_reader('midnights', lambda query_string, ts_range: pd.Series(index=pd.date_range(ts_range['$gt'], ts_range['$lte'], freq='D', normalize=True)).fillna('Text for annotation - midnight')) | |
| # Sample timeseries reader : | |
| # def get_sine(freq, ts_range): | |
| # freq = int(freq) | |
| # ts = pd.date_range(ts_range['$gt'], ts_range['$lte'], freq='H') | |
| # return pd.Series(np.sin(np.arange(len(ts)) * np.pi * freq * 2 / float(len(ts))), index=ts).to_frame('value') | |
| # add_reader('sine_wave', get_sine) | |
| # To query the wanted reader, use `<reader_name>:<query_string>`, e.g. 'sine_wave:24' | |
| app.run(host='0.0.0.0', port=3003, debug=True) |
I'm triying to create a dashboard to visualize some data from pandas dataframe.
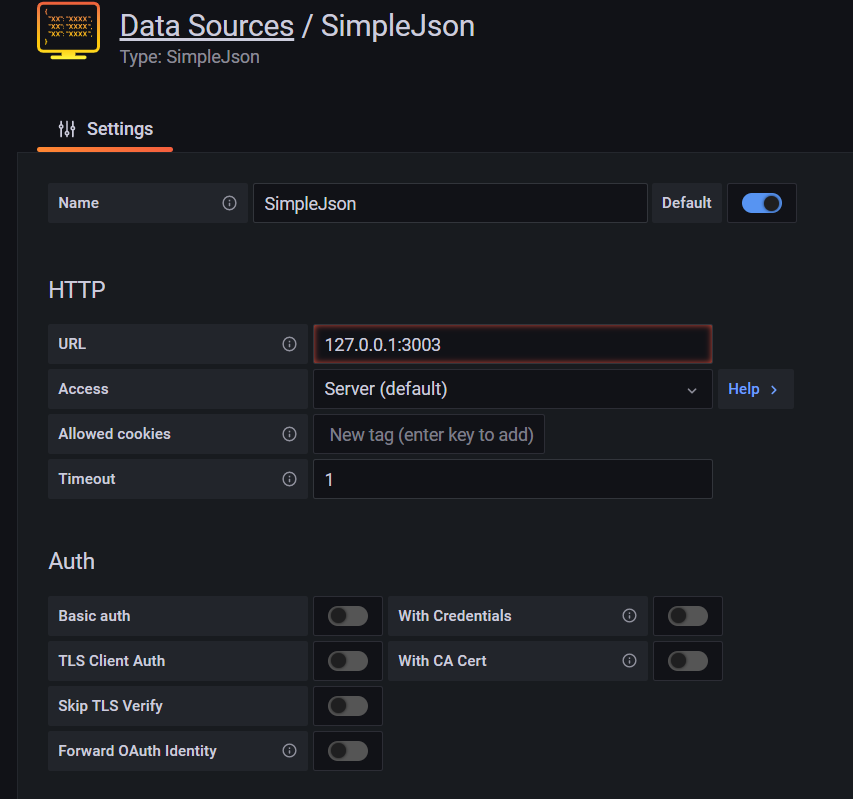
As a beginner using grafana, the documentation lacks for detailled explanation for beginners in how to configure SimpleJson datasource and use it. After some search on internet I try to run this script and have the following error : <!DOCTYPE HTML PUBLIC "-//W3C//DTD HTML 3.2 Final//EN"> <title>400 Bad Request</title> <h1>Bad Request</h1> <p>Failed to decode JSON object: Expecting value: line 1 column 1 (char 0)</p> after some search on internet, It seems to be a Flask problem, but I'm not sure.
I'm stuck in this step
Can anyone what Im doing wrong? Thanks in advance
Hi,
@linar-jether added the note to the Gist's title recently, but nevertheless we would like to add a corresponding comment here: We converged this code into a dedicated repository grafana-pandas-datasource the other day [1] and will be happy to receive contributions of any kind. The program is also just making it into the grafana-awesome compilation [2] curated by @zuchka - thanks!
Thank you again, Linar!
With kind regards,
Andreas.
[1] grafana-toolbox/grafana-pandas-datasource#1
[2] zuchka/grafana-awesome#3
TypeError: DataFrame.resample() got an unexpected keyword argument 'how'
if I use create_app() it doesn't give this error but any print('test',flush=True) doesn't print anything on console .I tried debugger and many forms of print ..but failed . Now i can run this app but fail to understand the flow using print . Is it must of use create_app() function in code .
How can I now print values on console using print Any suggestions ?
Hi @tvirmani,
let us know if you have any problems to get grafana-pandas-datasource working. If you find any flaws, please report them on its issue tracker.
With kind regards,
Andreas.
Hey there,
great code!
unfortunately im not sure on how to extend it i got the example to run.
What i would like to achieve is, reading an entire Dataframe in a loop:
something like: