Last active
March 9, 2018 09:45
-
-
Save lotabout/c20bf3a61f2b4423d1d1ee2bfb27dd08 to your computer and use it in GitHub Desktop.
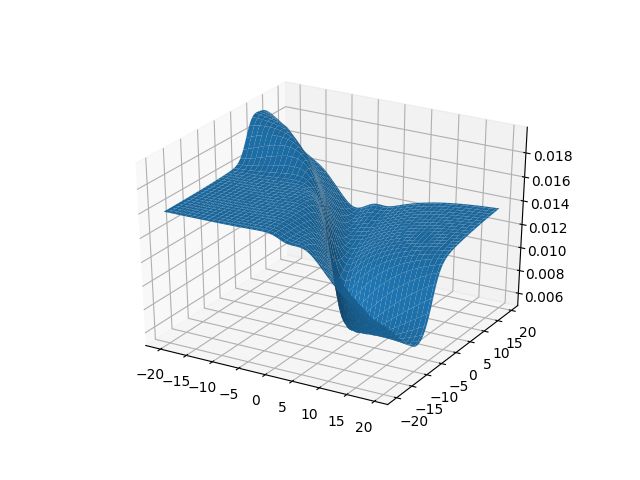
Try to plot squared cost function for logistic regression, trying to prove that it is non-convex
This file contains bidirectional Unicode text that may be interpreted or compiled differently than what appears below. To review, open the file in an editor that reveals hidden Unicode characters.
Learn more about bidirectional Unicode characters
| import numpy as np | |
| import matplotlib.pyplot as plt | |
| from mpl_toolkits.mplot3d import Axes3D | |
| import math | |
| #============================================================================== | |
| # Try to verify the cost function is non-convex | |
| xs = np.random.rand(30) | |
| ys = np.random.rand(30) | |
| labels = np.array([1 if x + y > 1 else 0 for x, y in zip(xs, ys)]) | |
| def sigmoid(x, y, t1, t2): | |
| return 1/(1 + math.e**(-t1*x -t2*y)) | |
| def cost(t1,t2): | |
| diffs = [(sigmoid(x,y, t1,t2) - z) for x,y,z in zip(xs,ys,labels)] | |
| return sum(0.5 * diff * diff for diff in diffs)/500 | |
| x = y = np.arange(-20, 20, 0.5) | |
| X, Y = np.meshgrid(x, y) | |
| zs = np.array([cost(x, y) for x, y in zip(np.ravel(X), np.ravel(Y))]) | |
| Z = zs.reshape(X.shape) | |
| fig = plt.figure() | |
| ax = fig.add_subplot(111, projection='3d') | |
| ax.plot_surface(X, Y, Z) | |
| plt.show() |
Note that here is another source that give examples on how it is non-convex: https://math.stackexchange.com/questions/2381724/logistic-regression-when-can-the-cost-function-be-non-convex/2381748#2381748?newreg=5cbf2a241e8b4a18ac3b434a402ed51a
Here is 1D version
samples = [(-5, 1), (-20, 0), (-2, 1)]

def sigmoid(theta, x):
    return 1/(1 + math.e**(- theta*x))

def cost(theta):
    diffs = [(sigmoid(theta, x) - y) for x,y in samples]
    return sum(diff * diff for diff in diffs)/len(samples)/2

X = np.arange(-1, 1, 0.01)
Y = np.array([cost(theta) for theta in X])
plt.plot(X, Y)
plt.show()
Sign up for free
to join this conversation on GitHub.
Already have an account?
Sign in to comment
Here is a sample plot. May not be obvious enough, but there is a "flat" area.