Skip to content

Instantly share code, notes, and snippets.

@lusis
Created October 25, 2012 12:48
Show Gist options
  • Star 5 You must be signed in to star a gist
  • Fork 0 You must be signed in to fork a gist
  • Save lusis/3952375 to your computer and use it in GitHub Desktop.
Save lusis/3952375 to your computer and use it in GitHub Desktop.
What happened here?

Random idea

I'm a big fan of the Ops School idea. I've struggled for years about how to "train up" someone coming into this field. So much of our skill set is forged in the fire of outages and troubleshooting.

One of the things that is both good and bad about system administration and operations is that we tend to see patterns. It's good in that we immediately see things that stand out. The downside is we tend to superimpose that pattern recognition in inappropriate ways.

We had an interesting issue happen yesterday at the dayjob. I won't go into exactly what it was here but I had an idea based on some graphs I was looking at. It's part social experiment but it's also part problem solving skills.

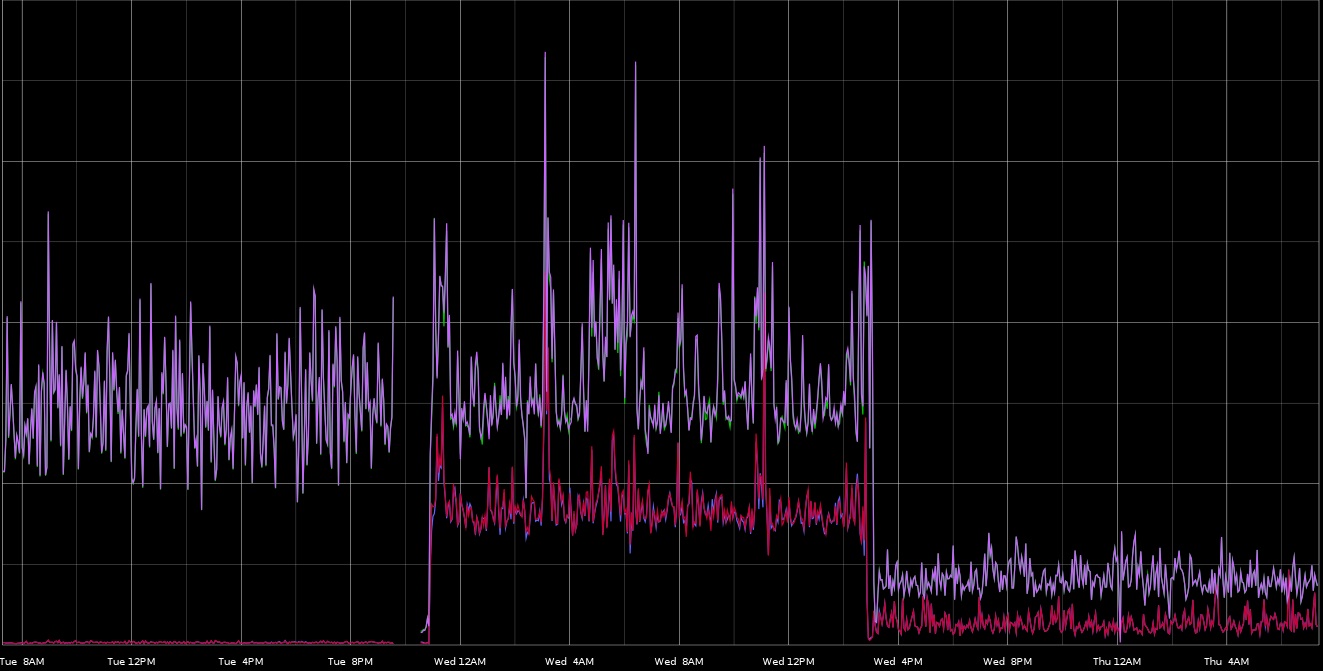
Given the following image with no context, what do you think happened? What are some of the key indicator points that jump out and what pattern do they call to mind?

(Since it may not be clear simply from an image resolution perspective, there are 4 metrics in this graph)

an graph

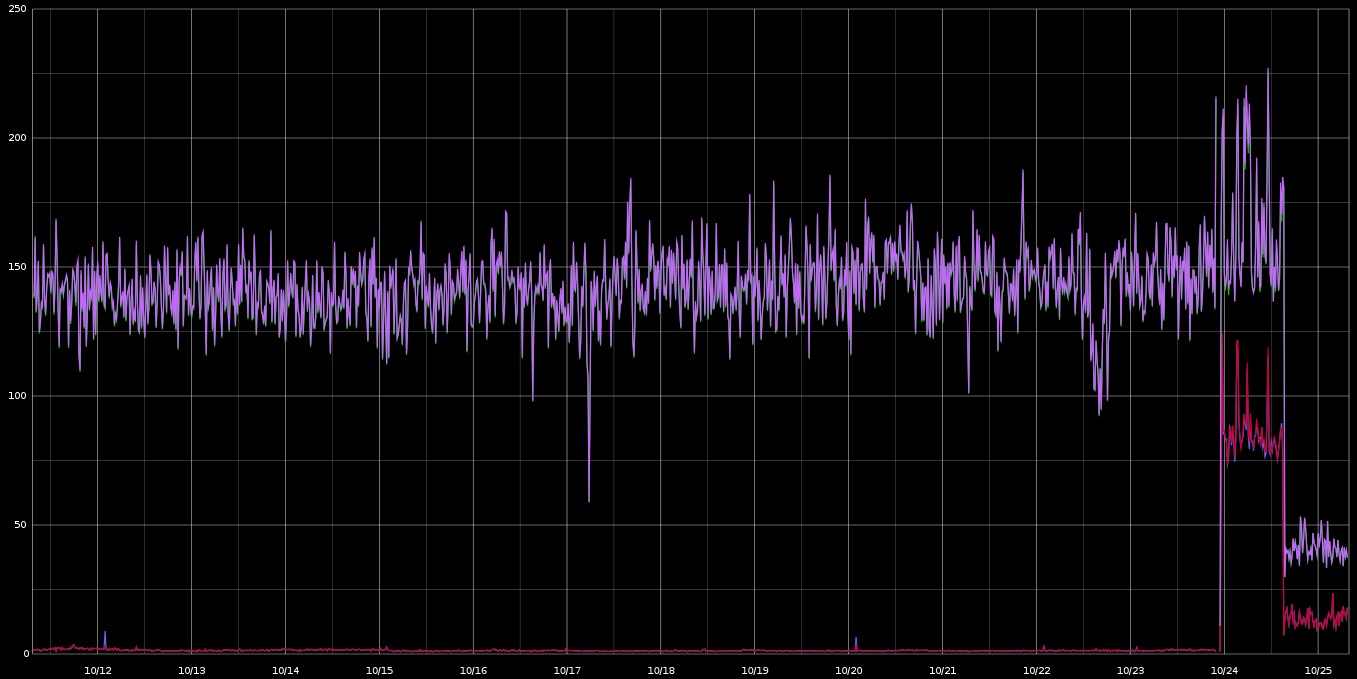
You can probably spot some common patterns in this graph. Here's a bit more historical context:

an historical graph

@lusis
Copy link
Author

lusis commented Oct 25, 2012

FWIW, I'll probably post the details of exactly what happened tomorrow. Just want to see what others think.

@obfuscurity
Copy link

Ok, I'll bite.

The first key indicator is the loss of metrics. That tells me the host went down (or encountered resource exhaustion) or the metrics collection stopped working. Since the pattern changes after recovery, I think it's safe to assume the former.

The second indicator is the change in activity in what we'll call the "secondary" group of metrics. We're seeing some periodic behavior mirroring in relation to the "primary" (purple) metric. This tells me there's some causation but we don't know which way.

The last key indicator is the "scaling down" of all the metrics. This seems to imply you were able to throw additional resources at whatever's going on here, but we're guessing that "low values are good" and "high values are bad" without really knowing. I'm assuming that the red/blue/??? metrics are a measurement of errors; if low values were "bad" then I'd expect an inverse relationship (errors to spike as throughput decreased).

@pguth66
Copy link

pguth66 commented Oct 25, 2012

ooo! oooo!

So really this is an exercise in "guess what kind of graph this is." Jason is assumning these are all metrics from a single host, I don't know if we can assume that. So what do we know?

  • The scale shows the metric's value is around 150. So it ain't CPU or memory. IOPS jumps out at me, but it could be network activity. Buffers in use? Depth of listen queue?
  • after the missing data period, there is clear mirrored behavior - peaks with peaks, troughs with troughs - this could be because one metric is an aggregate that includes the other, but it'd be weird to have an aggregate and not show all the constituent metrics, so it's more likely mirrored system behavior - e.g. some kind of syncing behavior (like IOPS on two drives, if a rebuild is in progress, or reads v writes during ETL) or symmetric measurements (like in/out network bandwidth)
  • after 16 hours, the metric absolute value falls and loses its mirrored characteristic - peaks and troughs no longer correspond, which lends credence to the symmetric behavior theory rather than the aggregated metrics theory (although it could still be either)

What it kinda looks like is:

  • system A under load
  • system A fails
  • system A is brought back up
  • ops goes "wtf why isn't system B running too"
  • system B is brought up along with system A
  • there is a syncing process between the two systems
  • when sync finishes, equilibrium is reached and load is split (unevenly)

maybe not load, maybe something like buffers.

insufficient data

@obfuscurity
Copy link

@pguth66 - I like the way you think. But I don't think you'd see such a pronounced drop-off at equilibrium.

@obfuscurity
Copy link

It also occurred to me that we could be looking at IO, but I don't think so. If only because one typically tracks reads/writes and iops/octets in the same graph (by convention, if not necessity). Instead, it looks to me like a simple latency graph... either web requests or something like time-to-completion of some action or script.

@jjb
Copy link

jjb commented Oct 25, 2012

my first simple guess looking at the first graph is that purple is memory usage and red is disk access events. memory runs out and VM kicks in. then, operator intervenes, kills some big processes and both go down. VM doesn't go down to zero right away because some that got swapped into disk isn't needed right now so there's no reason to swap it back.

however that doesn't account for the metrics gap that @obfuscurity brought up. also, memory usage lines don't usually look so jagged, so it's probably not memory at all :)

@lusis could you tell us if the Y axis is the same units for all the metrics?

@imbriaco
Copy link

Guess: EBS got slow and affected top-line response time.

Sign up for free to join this conversation on GitHub. Already have an account? Sign in to comment