Last active
September 4, 2022 16:49
-
-
Save lzpel/96847525244c3f69563be971e2ad3b06 to your computer and use it in GitHub Desktop.
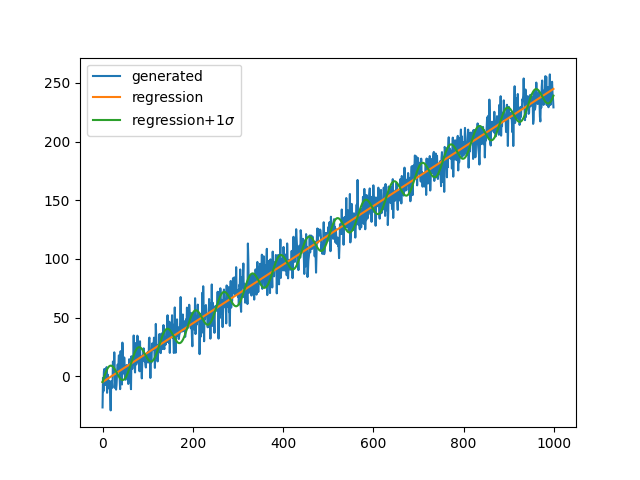
simple liner regression with numpy
This file contains bidirectional Unicode text that may be interpreted or compiled differently than what appears below. To review, open the file in an editor that reveals hidden Unicode characters.
Learn more about bidirectional Unicode characters
| import numpy as np | |
| import matplotlib.pyplot as plt | |
| def generate(a, b, c, n=1000): | |
| print("傾き {}, 切片 {}, 誤差標準偏差 {}".format(a, b, c)) | |
| x = np.arange(n) | |
| y = a * x + b + c * np.random.normal(size=n) | |
| return x, y | |
| def regression(x, y): | |
| cov = np.cov(x, y) | |
| Sxx, Sxy, Syy = cov[0, 0], cov[0, 1], cov[1, 1] | |
| # assert Sxx == np.var(x, ddof=1) # same value, unbiased variance | |
| # assert Syy == np.var(y, ddof=1) # same value, unbiased variance | |
| a, b, c = Sxy / Sxx, np.mean(y) - Sxy / Sxx * np.mean(x), np.sqrt(Syy - Sxy ** 2 / Sxx) | |
| print("傾き(推定) {}, 切片(推定) {}, 残差標準偏差 {}".format(a, b, c)) | |
| return a, b, c | |
| def main(): | |
| fig = plt.figure() | |
| ax = fig.add_subplot(111) | |
| x, y = generate(0.25, -4.5, 10) | |
| ax.plot(x, y, label="generated") | |
| a, b, c = regression(x, y) | |
| ax.plot(x, a * x + b, label="regression") | |
| ax.plot(x, a * x + b + c * np.sin(x / len(x) * 100), label="regression+$1\sigma$") | |
| ax.legend() | |
| plt.show() | |
| if __name__ == "__main__": | |
| main() |
Author
lzpel
commented
Sep 4, 2022
Sign up for free
to join this conversation on GitHub.
Already have an account?
Sign in to comment