Last active
September 6, 2022 11:41
-
-
Save lzpel/dbd338ff14327768c832edfa8cbdd3dd to your computer and use it in GitHub Desktop.
numpy fft example
This file contains bidirectional Unicode text that may be interpreted or compiled differently than what appears below. To review, open the file in an editor that reveals hidden Unicode characters.
Learn more about bidirectional Unicode characters
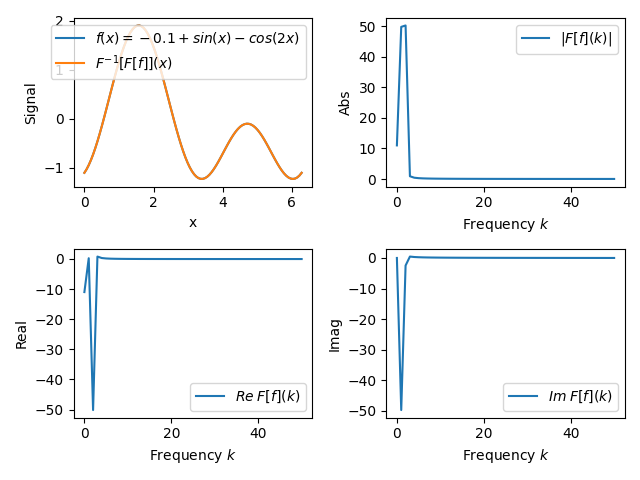
| import numpy as np | |
| import matplotlib.pyplot as plt | |
| def fftTest(): | |
| x = np.linspace(0, 2 * np.pi, 100) | |
| f = -0.1 + np.sin(x) - np.cos(2 * x) # 元関数 | |
| F = np.fft.rfft(f) # 実数離散FFT | |
| for i, Fi in enumerate(F): # FFT結果の複素数を表示 | |
| print(i, "{:2.2f}".format(Fi)) | |
| fig = plt.figure() | |
| ax = fig.add_subplot(221) | |
| ax.plot(x, f, label='$f(x)=-0.1+sin(x)-cos(2x)$') | |
| ax.plot(x, np.fft.irfft(F), label='$F^{-1}[F[f]](x)$') | |
| ax.set_xlabel("x") | |
| ax.set_ylabel("Signal") | |
| ax.legend() | |
| ax = fig.add_subplot(222) | |
| ax.plot(np.abs(F), label='$|F[f](k)|$') | |
| ax.set_xlabel('Frequency $k$') | |
| ax.set_ylabel('Abs') | |
| ax.legend() | |
| ax = fig.add_subplot(223) | |
| ax.plot(F.real, label=r'$Re\;F[f](k)$') | |
| ax.set_xlabel('Frequency $k$') | |
| ax.set_ylabel('Real') | |
| ax.legend() | |
| ax = fig.add_subplot(224) | |
| ax.plot(F.imag, label=r'$Im\;F[f](k)$') | |
| ax.set_xlabel('Frequency $k$') | |
| ax.set_ylabel('Imag') | |
| ax.legend() | |
| fig.tight_layout() | |
| plt.show() | |
| if __name__ == "__main__": | |
| fftTest() |
Author
lzpel
commented
Sep 6, 2022
Sign up for free
to join this conversation on GitHub.
Already have an account?
Sign in to comment