Last active
March 10, 2023 18:27
-
-
Save marcosfelt/6e3de70497b6c66e7b62ddd785d19243 to your computer and use it in GitHub Desktop.
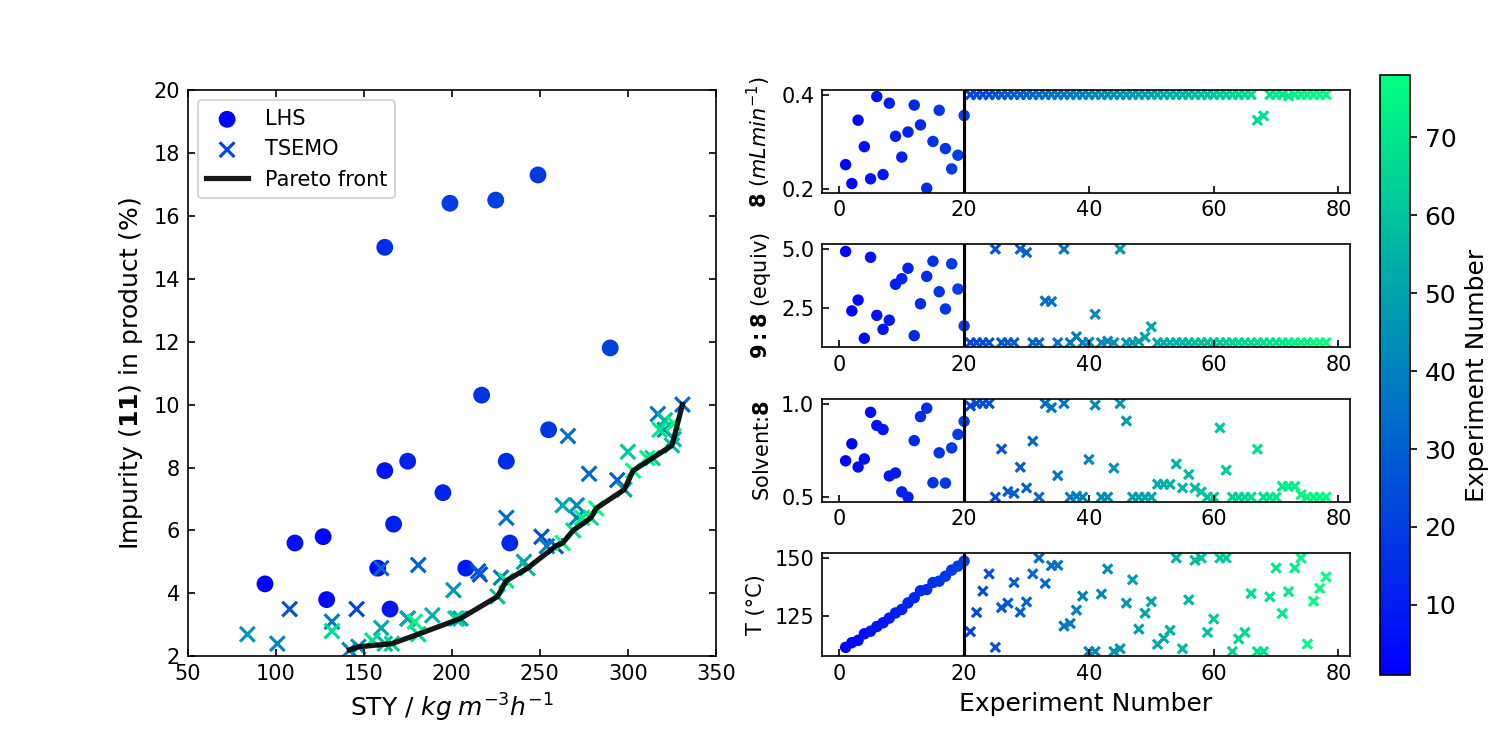
Flow chemistry data visualization based on data from Schweidtmann et al.
This file contains bidirectional Unicode text that may be interpreted or compiled differently than what appears below. To review, open the file in an editor that reveals hidden Unicode characters.
Learn more about bidirectional Unicode characters
| import numpy as np | |
| def pareto_efficient(data, maximize=True): | |
| """ | |
| Copied from Summit, which in turn was probably copied from Stackoverflow | |
| Find the pareto-efficient points | |
| Parameters | |
| --------- | |
| data: array-like | |
| An (n_points, n_data) array | |
| maximize: bool, optional | |
| Whether the problem is a maximization or minimization problem. | |
| Defaults to maximization (i.e,. True) | |
| Returns | |
| ------- | |
| data, indices: | |
| data is an array with the pareto front values | |
| indices is an array with the indices of the pareto points in the original data array | |
| """ | |
| indices = np.arange(data.shape[0]) | |
| next_point_index = 0 # Next index in the indices array to search for | |
| while next_point_index < len(data): | |
| if maximize: | |
| nondominated_point_mask = np.any(data > data[next_point_index], axis=1) | |
| else: | |
| nondominated_point_mask = np.any(data < data[next_point_index], axis=1) | |
| nondominated_point_mask[next_point_index] = True | |
| indices = indices[nondominated_point_mask] # Remove dominated points | |
| data = data[nondominated_point_mask] | |
| next_point_index = np.sum(nondominated_point_mask[:next_point_index]) + 1 | |
| return data, indices |
This file contains bidirectional Unicode text that may be interpreted or compiled differently than what appears below. To review, open the file in an editor that reveals hidden Unicode characters.
Learn more about bidirectional Unicode characters
| Entry | 6/mL min-1 | 7:06 | Solvent:6 | Temp/°C | % Impurity | STY/kg m-3 h-1 | 8/% | |
|---|---|---|---|---|---|---|---|---|
| 1 | 0.252 | 4.9 | 0.694 | 111.8 | 4.3 | 94 | 29.4 | |
| 2 | 0.212 | 2.36 | 0.785 | 113.8 | 5.8 | 127 | 47.3 | |
| 3 | 0.346 | 2.823 | 0.661 | 114.8 | 3.8 | 129 | 29.4 | |
| 4 | 0.29 | 1.189 | 0.704 | 117.6 | 4.8 | 158 | 42.9 | |
| 5 | 0.222 | 4.65 | 0.953 | 118.7 | 5.6 | 111 | 39.5 | |
| 6 | 0.396 | 2.169 | 0.883 | 120.7 | 3.5 | 165 | 32.8 | |
| 7 | 0.231 | 1.57 | 0.861 | 122.3 | 7.9 | 162 | 55.3 | |
| 8 | 0.382 | 1.962 | 0.613 | 124.3 | 4.8 | 208 | 43 | |
| 9 | 0.312 | 3.497 | 0.629 | 126.5 | 6.2 | 167 | 42.2 | |
| 10 | 0.268 | 3.736 | 0.528 | 128 | 8.2 | 175 | 51.4 | |
| 11 | 0.321 | 4.182 | 0.5 | 130.8 | 7.2 | 195 | 47.9 | |
| 12 | 0.378 | 1.301 | 0.802 | 133 | 5.6 | 233 | 48.7 | |
| 13 | 0.336 | 2.664 | 0.93 | 136 | 8.2 | 231 | 54.2 | |
| 14 | 0.202 | 3.835 | 0.975 | 136.5 | 15 | 162 | 63.4 | |
| 15 | 0.301 | 4.482 | 0.577 | 139.5 | 10.3 | 217 | 56.8 | |
| 16 | 0.367 | 3.178 | 0.737 | 140.1 | 9.2 | 255 | 54.7 | |
| 17 | 0.286 | 2.442 | 0.575 | 142.2 | 17.3 | 249 | 68.6 | |
| 18 | 0.243 | 4.373 | 0.763 | 144.8 | 16.4 | 199 | 64.6 | |
| 19 | 0.272 | 3.293 | 0.835 | 146.5 | 16.5 | 225 | 65.3 | |
| 20 | 0.356 | 1.719 | 0.905 | 148.7 | 11.8 | 290 | 64.1 | |
| 21 | 0.4 | 1 | 0.987 | 118.5 | 3.5 | 146 | 28.8 | |
| 22 | 0.4 | 1 | 1 | 126.7 | 3.2 | 175 | 34.6 | |
| 23 | 0.4 | 1 | 1 | 135.8 | 4.6 | 216 | 42.5 | |
| 24 | 0.4 | 1 | 1 | 143.2 | 5.8 | 251 | 49.4 | |
| 25 | 0.4 | 5 | 0.5 | 111.8 | 3.5 | 108 | 21.2 | |
| 26 | 0.4 | 1 | 0.757 | 128.8 | 4.7 | 215 | 42.5 | |
| 27 | 0.4 | 1 | 0.53 | 130.7 | 5.5 | 259 | 51.1 | |
| 28 | 0.4 | 1 | 0.52 | 139.5 | 7.6 | 294 | 57.9 | |
| 29 | 0.4 | 5 | 0.66 | 126.8 | 4.8 | 160 | 31.5 | |
| 30 | 0.4 | 4.852 | 0.549 | 131.2 | 4.9 | 181 | 35.8 | |
| 31 | 0.4 | 1 | 0.799 | 143.2 | 7.8 | 278 | 54.9 | |
| 32 | 0.4 | 1 | 0.5 | 150 | 10 | 331 | 65.2 | |
| 33 | 0.4 | 2.785 | 1 | 139.1 | 6.4 | 231 | 45.5 | |
| 34 | 0.4 | 2.755 | 0.978 | 146.7 | 9 | 266 | 52.5 | |
| 35 | 0.4 | 1 | 0.615 | 146.9 | 9.7 | 317 | 62.4 | |
| 36 | 0.4 | 5 | 1 | 120.9 | 3.1 | 132 | 26 | |
| 37 | 0.4 | 1 | 0.5 | 122 | 4.5 | 228 | 44.9 | |
| 38 | 0.4 | 1.259 | 0.505 | 127.7 | 5.5 | 254 | 50.2 | |
| 39 | 0.4 | 1 | 0.5 | 133.7 | 6.4 | 271 | 53.5 | |
| 40 | 0.4 | 1.026 | 0.701 | 110 | 2.2 | 142 | 27.9 | |
| 41 | 0.4 | 2.216 | 0.992 | 110 | 2.4 | 101 | 20 | |
| 42 | 0.4 | 1 | 0.5 | 134.6 | 6.8 | 271 | 53.5 | |
| 43 | 0.4 | 1.068 | 0.5 | 145.3 | 9.2 | 321 | 63.4 | |
| 44 | 0.4 | 1 | 0.655 | 110 | 2.3 | 147 | 28.9 | |
| 45 | 0.4 | 5 | 1 | 111.2 | 2.7 | 84 | 16.6 | |
| 46 | 0.4 | 1 | 0.907 | 130.7 | 4.1 | 201 | 39.7 | |
| 47 | 0.4 | 1 | 0.5 | 140.7 | 7.3 | 298 | 58.8 | |
| 48 | 0.4 | 1.055 | 0.5 | 119.6 | 3.2 | 205 | 40.3 | |
| 49 | 0.4 | 1.239 | 0.5 | 126.4 | 5 | 241 | 47.4 | |
| 50 | 0.4 | 1.682 | 0.5 | 131.3 | 6.8 | 263 | 51.9 | |
| 51 | 0.4 | 1 | 0.569 | 113.1 | 2.9 | 160 | 31.5 | |
| 52 | 0.4 | 1 | 0.569 | 115.7 | 3.2 | 175 | 34.5 | |
| 53 | 0.4 | 1 | 0.568 | 119.1 | 3.3 | 189 | 37.3 | |
| 54 | 0.4 | 1.005 | 0.677 | 150 | 8.9 | 326 | 64.2 | |
| 55 | 0.4 | 1 | 0.549 | 111.2 | 2.4 | 162 | 31.9 | |
| 56 | 0.4 | 1 | 0.621 | 132.1 | 4.8 | 243 | 48 | |
| 57 | 0.4 | 1 | 0.549 | 149 | 9.5 | 321 | 63.4 | |
| 58 | 0.4 | 1 | 0.528 | 150 | 8.7 | 325 | 64.2 | |
| 59 | 0.4 | 1 | 0.5 | 118.2 | 3.2 | 203 | 40 | |
| 60 | 0.4 | 1 | 0.5 | 123.9 | 3.9 | 226 | 44.6 | |
| 61 | 0.4 | 1 | 0.87 | 150 | 8.5 | 300 | 59.1 | |
| 62 | 0.4 | 1 | 0.644 | 150 | 8.3 | 314 | 61.9 | |
| 63 | 0.4 | 1 | 0.5 | 110 | 2.4 | 166 | 32.7 | |
| 64 | 0.4 | 1 | 0.5 | 115.4 | 2.7 | 181 | 35.8 | |
| 65 | 0.4 | 1 | 0.5 | 118.2 | 3.2 | 202 | 39.8 | |
| 66 | 0.4 | 1 | 0.5 | 134.8 | 6.4 | 279 | 54.9 | |
| 67 | 0.346 | 1.001 | 0.756 | 110 | 2.8 | 132 | 30.1 | |
| 68 | 0.355 | 1 | 0.5 | 110 | 2.5 | 155 | 34.5 | |
| 69 | 0.4 | 1 | 0.5 | 133.4 | 6 | 269 | 53 | |
| 70 | 0.4 | 1 | 0.5 | 145.7 | 9.2 | 318 | 62.8 | |
| 71 | 0.4 | 1 | 0.558 | 126.3 | 4.4 | 231 | 45.6 | |
| 72 | 0.397 | 1 | 0.558 | 135.6 | 6.4 | 274 | 54.4 | |
| 73 | 0.4 | 1 | 0.558 | 145.7 | 8.3 | 311 | 61.3 | |
| 74 | 0.4 | 1 | 0.513 | 150 | 9.4 | 326 | 64.4 | |
| 75 | 0.4 | 1 | 0.5 | 113.2 | 3.1 | 179 | 35.2 | |
| 76 | 0.4 | 1 | 0.5 | 131.5 | 5.6 | 263 | 51.8 | |
| 77 | 0.4 | 1 | 0.5 | 137 | 6.7 | 282 | 55.7 | |
| 78 | 0.4 | 1 | 0.5 | 141.9 | 7.9 | 303 | 59.8 |
This file contains bidirectional Unicode text that may be interpreted or compiled differently than what appears below. To review, open the file in an editor that reveals hidden Unicode characters.
Learn more about bidirectional Unicode characters
| import pandas as pd | |
| import matplotlib.pyplot as plt | |
| from matplotlib.colors import Normalize | |
| import numpy as np | |
| from pareto_front import pareto_efficient.py | |
| # Get data | |
| df = pd.read_csv('data/schweidtmann.csv') | |
| df["strategy"] = "LHS" | |
| df.loc[20:, "strategy"] = "TSEMO" | |
| # Calculate pareto front | |
| arr = df[["STY/kg m-3 h-1", "% Impurity"]].to_numpy() | |
| arr[:, 1] *= -1.0 | |
| pareto, indices = pareto_efficient(arr, maximize=True) | |
| pareto[:,1] *= -1.0 | |
| pareto = np.sort(pareto, axis=0) | |
| fig = plt.figure(figsize=(10,5)) | |
| fig.subplots_adjust(hspace=0.5) | |
| fontsize=12 | |
| # Pareto plot | |
| ax = fig.add_subplot(1, 2, 1) | |
| markers=["o", "x"] | |
| # Used copper for the paper | |
| cmap = plt.get_cmap("winter", len(df)) | |
| for i, strategy in enumerate(["LHS", "TSEMO"]): | |
| tmp = df[df["strategy"]==strategy] | |
| colors = cmap(tmp["Entry"].to_numpy()) | |
| ax.scatter( | |
| data=tmp, | |
| x="STY/kg m-3 h-1", | |
| y="% Impurity", | |
| # ax=ax, | |
| label=strategy, | |
| marker=markers[i], | |
| s=50, | |
| c=colors | |
| ) | |
| ax.plot(pareto[:,0], pareto[:,1], linewidth=2.5, color="k",alpha=0.9, label="Pareto front") | |
| ax.set_xlim(50, 350) | |
| ax.set_ylim(2, 20) | |
| ax.legend(loc="upper left") | |
| ax.set_xlabel(r"STY / $kg \; m^{-3} h^{-1}$", fontsize=fontsize) | |
| ax.set_ylabel(r"Impurity ($\bf 11$) in product (%)", fontsize=fontsize) | |
| ax.tick_params(direction="in", which="both", right="on", top="on") | |
| # Decision variables | |
| decision_vars = ["6/mL min-1", "7:06", "Solvent:6", "Temp/°C"] | |
| ylabels = [ | |
| r"$\bf 8$ $(mL min^{-1})$", | |
| r"$\bf 9:8$ (equiv)", | |
| r"Solvent:$\bf 8$", | |
| "T (°C)" | |
| ] | |
| for i, dv in enumerate(decision_vars): | |
| ax = fig.add_subplot(4,2,2*(i+1)) | |
| for j, strategy in enumerate(["LHS", "TSEMO"]): | |
| tmp = df[df["strategy"]==strategy] | |
| colors = cmap(tmp["Entry"].to_numpy()) | |
| tmp.plot.scatter("Entry", dv, marker=markers[j], ax=ax, c=colors) | |
| ax.set_xlabel("") | |
| ax.tick_params(direction="in") | |
| ax.set_ylabel(ylabels[i]) | |
| ax.axvline(20, color="k") | |
| ax.set_xlabel("Experiment Number", fontsize=12) | |
| # colorbar | |
| cax = plt.axes([0.92, 0.1, 0.02, 0.8]) | |
| norm = Normalize(vmin=1, vmax=len(df)) | |
| sm = plt.cm.ScalarMappable(cmap=cmap, norm=norm) | |
| sm.set_array([]) | |
| cbar = fig.colorbar(sm,cax=cax,) | |
| cbar.set_label(label="Experiment Number", size=12) | |
| cax.tick_params(labelsize='large') | |
| # cax.yaxis.set_ticks_position('left') | |
| # cax.yaxis.set_label_position('left') | |
| # Save | |
| fig.savefig("schweidtmann.png", dpi=150) |
Sign up for free
to join this conversation on GitHub.
Already have an account?
Sign in to comment
This is code for a figure from the paper A Brief Introduction to Chemical Reaction Optimization. The data comes from this paper by Schweidtmann et al.