| title | theme | revealOptions | ||
|---|---|---|---|---|
Kernel Density Estimation |
solarized |
|
You have observed i.i.d. datapoints from an unknown distribution
You want to estimate the pdf
or simply so you can plot it!
Assume you know at least the parametric family of

You then have methods like maximum likelihood estimation:
https://www.statlect.com/fundamentals-of-statistics/normal-distribution-maximum-likelihood
If you don't want to assume a distribution family, you can try to plot the values directly - not so useful is it?

Better is to make a histogram:
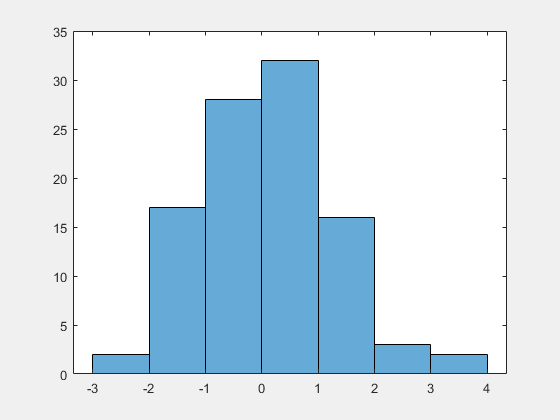
- Very coarse and not smooth
- Heavily dependent on the number of bins
- Outliers influence min/max and thus the bin choice
a.k.a. Parzen-Rosenblatt Method
Idea: density
Here
Note: Time for a picture

Experimentally - Choice of kernel doesn't matter that much. Bandwidth is much more important!
<iframe height="600px" width="960px" src="https://en.wikipedia.org/wiki/Kernel_(statistics)#Kernel_functions_in_common_use"> </iframe>

We might want to minimize the "squared error" - how close is
This is called the mean integrated squared error:
Warning:
$f$ is unknown!
Sketch
- Choose a pilot distribution for
$f$ , e.g. a quick KDE - Taylor expand
$MISE$ - Solve simpler optimization problem (polynomial)
This gives you a concrete formula!
Warning: This depends heavily on the choise of pilot function
Sketch of algorithm
- Split examples into train
$T$ and validation$V$ - Estimate
$\hat{f_h}$ on the train set for a number of$h$ 's. - Compute likelihood of test for this model:
$$L=\prod_{i\in V} \hat{f_h}(x_i ; \{x_j\}_{j\in T})$$ - Choose the
$h$ with the highest likelihood
You might want to use leave-one-out validation or K-fold CV. Also this is very sensitive to outliers.
There is so much more to say and learn!
- How does this work in more dimensions?
- How do you use this for outlier detection?
- What are the confidence bounds?
- ...
- Nice visuals: https://mathisonian.github.io/kde/
- Wikipedia: https://en.wikipedia.org/wiki/Kernel_density_estimation
- Overview paper: https://arxiv.org/abs/1704.03924