Last active
May 5, 2023 09:30
-
-
Save matt-dray/f150fa332cce4c509d5a85577e6d8fbf to your computer and use it in GitHub Desktop.
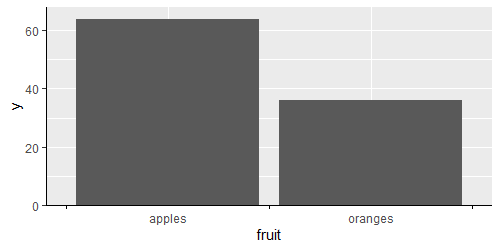
Can you move tickmarks between bars on the categorical x-axis of a {ggplot2} barplot?
This file contains bidirectional Unicode text that may be interpreted or compiled differently than what appears below. To review, open the file in an editor that reveals hidden Unicode characters.
Learn more about bidirectional Unicode characters
| # From the Analysis Function's guidance on charts: 'When an axis shows | |
| # categorical data, you do not necessarily need tick marks, but if you do use | |
| # them labels should be aligned between them.' Is this actually possible in | |
| # ggplot2? A quick example. | |
| # | |
| # Link to guidance: | |
| # https://analysisfunction.civilservice.gov.uk/policy-store/data-visualisation-charts/#section-3:~:text=on%20the%20chart.-,Tick%20marks,-Tick%20marks%20are | |
| library(ggplot2) | |
| fruit_df <- data.frame(fruit = sample(c("apples", "oranges"), 100, TRUE)) | |
| ggplot(fruit_df) + | |
| geom_bar(aes(fruit)) + | |
| theme( | |
| axis.ticks.x = element_blank(), # delete ticks | |
| axis.line.y = element_line() # add y axis line | |
| ) + | |
| coord_cartesian(clip = "off", ylim = c(3, 65)) + # zoom y axis to extent | |
| geom_hline(yintercept = 0) + # add fake x axis | |
| annotate( # add fake ticks | |
| "segment", | |
| x = c(0.5, 1.5, 2.5), | |
| xend = c(0.5, 1.5, 2.5), | |
| y = 0, | |
| yend = -1.5 | |
| ) | |
| # For comparison, a simple sketch with base plot | |
| barplot(table(fruit_df), xlim = c(0.1, 2.5)) | |
| axis(side = 1, at = c(0.1, 1.3, 2.5), labels = NA) |
Sign up for free
to join this conversation on GitHub.
Already have an account?
Sign in to comment
Output of {ggplot2} code:


Output of the base R code: