<03.24.2017>
Grab this page here: http://bit.ly/gis-with-humanities
- Mehak Sachdeva, mailto:mehak@carto.com, @MehakSachdeva_
- Hi!
- maps we like
- recent maps we made
- Misc
Columbia has a CARTO site license where you get primo accounts :) If you don't have an account on this already, head to:
https://columbialibraries.carto.com/signup
Make sure to use your columbia.edu email address to signup.
CARTO is in the middle of upgrading all accounts from our old product (Editor) to the current one (Builder). If your account looks different from ours, let us know and we'll get you upgraded.
- easily overlay data onto a map
- analyze the data to reveal spatial patterns
- tell stories by creating beautiful visualizations
- and then share them with the world!
- SQL and PostGIS
- map styling with CartoCSS
- JavaScript for overlay and interactivity
- A tileserver turning all that data and styles to TILES
Add it up and you roughly get CARTO.

Look at our code! Find the errors bugging you, improve it, be a part of a community.
http://github.com/CartoDB/cartodb
Welcome to Carto Builder!
A peek at the map for this session: MOMA Artists Map

The source for this dataset is from the repository from MOMA.
Download the Dataset for this session HERE
- Style
- Animated Styling

- Connect with Lines

- Turbo-Carto (CartoCSS)
- Publish!
Shapefiles here:
A peek at the map for this session: Cook County, Illinois - Race

Analysis Used : Join Columns from Second Layer
-
Cleaning Started with this file: ACS_15_5YR_B02001_with_ann.csv
-
Joining:


- Calculations:
Within the SQL tray type:
UPDATE race_cook_county
SET aa_per = (estimate_total___black_or_african_american_alone:: float / estimate_total:: float) * 100
WHERE estimate_total != 0
- Styling:

- Widgets:

Using Data Observatory: Tool
Quick trick: From your Illinois shapefile in the SQL tray apply:
SELECT * FROM cb_2015_17_bg_500k
WHERE countyfp = '31'
OR
Just grab it here: Shapefile
Analysis Used: Data Observatory
Steps:


Finally:

- Before we dive into CARTO, let's talk a little bit about web maps
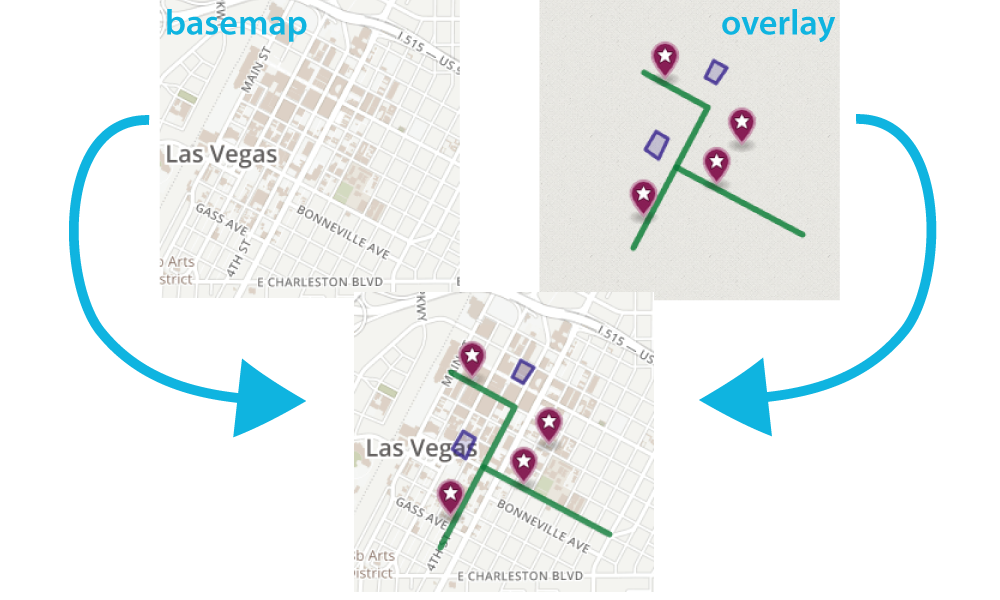
- When we talk about web maps, we are referring to a few different components:
- the map (a.k.a., basemap)
- the data overlay
- and the interface that the map sits in
A map that provides geographic context to help support a wide variety of overlays-typically raster tiles (pngs, jpegs, etc.).
The dimensions are 256x256 (or 512x512 for higher resolution) pixels and organized based on coordinates (x, y) and zoom levels (z).

There are also vector tiles: Google Maps, Mapbox, Mapzen
Defines the scale of the current map view. Ranges from 0 (entire world) to 21 (individual building level).
| zoom level | what you see |
|---|---|
| 0 | whole world from a ways away |
| 1 | whold world closer |
| 4 | north america |
| 7 | north east united states |
| 8 | new york state |
| 10 | new york area |
| 12 | new york city |
| 14 | manhattan |
| 16 | upper west side |
| 18 | south lawn |
| 20 | avery building |


vs.

There are tons of free ones: http://leaflet-extras.github.io/leaflet-providers/preview/
And you can design your own:
Themes of information overlaid on a basemap that help tell a story--typically vector.
Javascript/HTML/CSS for rendering on the web. E.g., D3.js generates SVGs (which can be parts of a map!) and manipulates them.
With these languages you can publish your map with the basetiles loaded and your data layers appropriately geocoded; with JavaScript you can also add to the interactivity of your map, revealing metadata in the tooltips