Three axes visualizations % matplotlib inline
import matplotlib .pyplot as plt
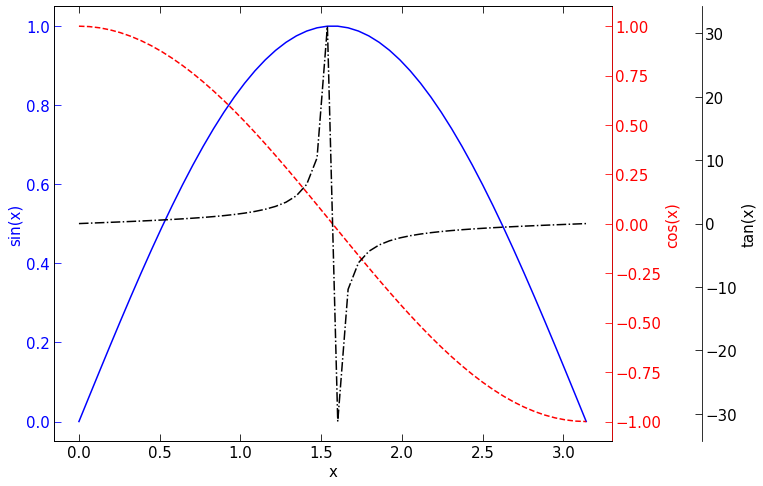
import numpy as np x = np .linspace (0 , 3.1415 )
y1 = np .sin (x )
y2 = np .cos (x )
y3 = np .tan (x )# cosmetics
fontsize = 15
direction = {'direction' :'in' , 'which' :'both' , 'right' :True , 'top' :True , 'size' :7 }
fig , ax1 = plt .subplots (figsize = (10 , 8 ))
# first curve
ax1 .plot (x , y1 , color = 'b' )
ax1 .set_ylabel (r'sin(x)' , color = 'b' , fontsize = fontsize )
ax1 .spines ['left' ].set_color ('b' )
ax1 .tick_params (axis = 'y' , colors = 'b' , labelsize = fontsize , ** direction )
ax1 .tick_params (axis = 'x' , labelsize = fontsize , ** direction ) # x- has a different color
ax1 .set_xlabel ('x' , fontsize = fontsize )
# second curve
ax2 = ax1 .twinx ()
ax2 .plot (x , y2 , color = 'r' , ls = '--' )
ax2 .set_ylabel ('cos(x)' , color = 'r' , fontsize = fontsize )
ax2 .tick_params (axis = 'both' , colors = 'r' , labelsize = fontsize , ** direction )
ax2 .spines ['right' ].set_color ('r' )
# third curve
ax3 = ax1 .twinx ()
ax3 .plot (x , y3 , color = 'k' , ls = '-.' )
ax3 .set_ylabel (r'tan(x)' , color = 'k' , fontsize = fontsize )
ax3 .tick_params (axis = 'both' , colors = 'k' , labelsize = fontsize , ** direction )
ax3 .spines ['right' ].set_color ('k' )
ax3 .spines ['right' ].set_position (('outward' , 90 ))
# save with 'fig.savefig'
You will get something like: