Created
July 19, 2018 19:15
-
-
Save michaelstepner/bbc8619614f7d42cc80f80b0e01557d8 to your computer and use it in GitHub Desktop.
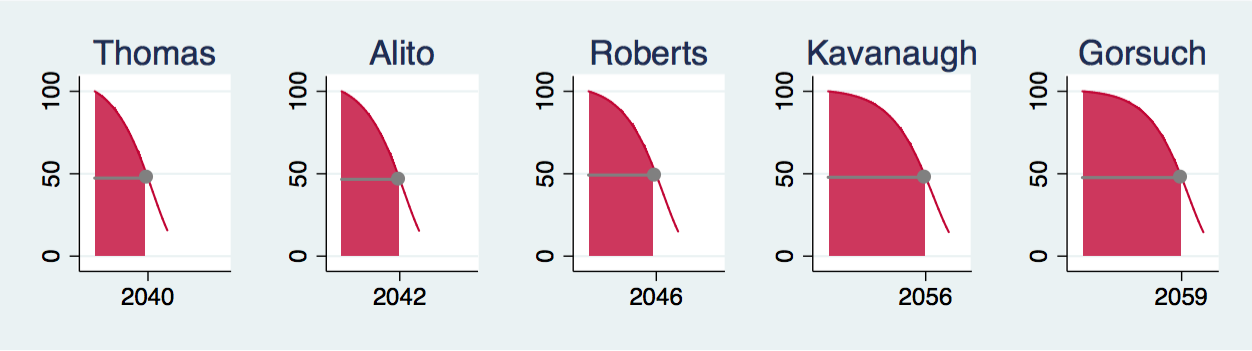
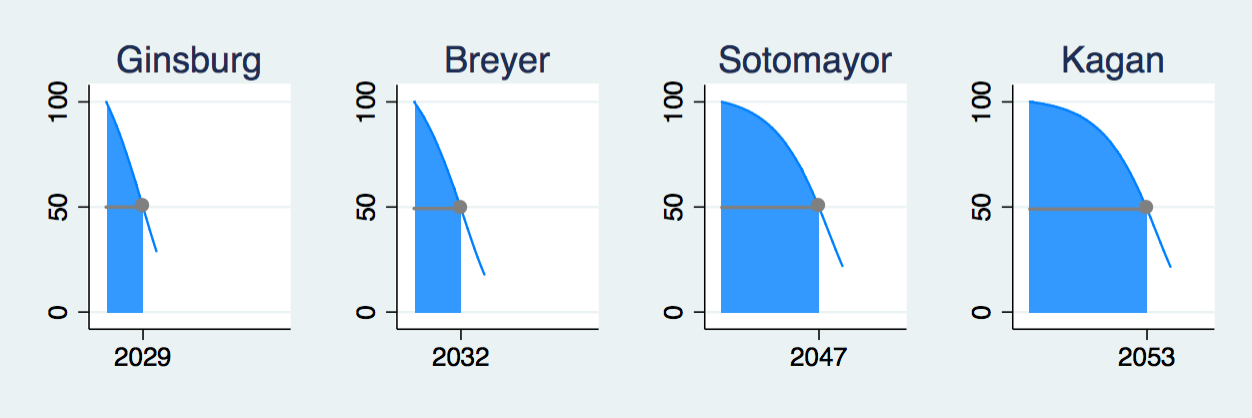
Expected survival probabilities of Supreme Court Justices, accounting for age, sex and income
This file contains bidirectional Unicode text that may be interpreted or compiled differently than what appears below. To review, open the file in an editor that reveals hidden Unicode characters.
Learn more about bidirectional Unicode characters
| * Load Health Inequality Project data | |
| use "https://healthinequality.org/dl/health_ineq_online_table_16.dta", clear | |
| * Combine all information from 2001-2014 | |
| isid gnd indv_pctile age age_at_d yod | |
| collapse (mean) mortrate indv_inc [w=count], by(gnd indv_pctile age_at_d) | |
| * Use income percentiles that approximate associate justice salary (~$213,900) | |
| * https://en.wikipedia.org/wiki/Federal_judge_salaries_in_the_United_States | |
| /* | |
| twoway (scatter indv_inc age_at_d if gnd=="M" & indv_pctile==97) | |
| twoway (scatter indv_inc age_at_d if gnd=="F" & indv_pctile==99) | |
| gen diff_supreme=abs(indv_inc-213900) | |
| */ | |
| keep if (gnd=="M" & indv_pctile==97) | (gnd=="F" & indv_pctile==99) | |
| isid gnd age_at_d | |
| drop indv_pctile | |
| sort gnd age_at_d | |
| * Extrapolate mortality using Gompertz approximation to age 100 | |
| gen logmort=log(mortrate) | |
| tw (scatter logmort age_at_d if gnd=="M") /// | |
| (lfit logmort age_at_d if gnd=="M") | |
| set obs 122 | |
| replace gnd=cond(mod(_n,2)==0,"M","F") if mi(gnd) | |
| sort gnd age_at_d | |
| replace age_at_d = age_at_d[_n-1] + 1 if mi(age_at_d) | |
| sort gnd age_at_d | |
| foreach g in "M" "F" { | |
| reg logmort age_at_d if gnd=="`g'" | |
| predict logmort_hat_`g' if gnd=="`g'", xb | |
| } | |
| tw (scatter logmort age_at_d if gnd=="M") /// | |
| (line logmort_hat_M age_at_d if gnd=="M") | |
| gen mortrate_pred=cond(gnd=="M",exp(logmort_hat_M),exp(logmort_hat_F)) | |
| * Generate survival probabilities for each justice | |
| rename age_at_d age | |
| gen surv_gorsuch=1 if gnd=="M" & age==50 | |
| gen surv_kavanaugh=1 if gnd=="M" & age==53 | |
| gen surv_roberts=1 if gnd=="M" & age==63 | |
| gen surv_alito=1 if gnd=="M" & age==68 | |
| gen surv_thomas=1 if gnd=="M" & age==70 | |
| gen surv_kagan=1 if gnd=="F" & age==58 | |
| gen surv_sotomayor=1 if gnd=="F" & age==64 | |
| gen surv_breyer=1 if gnd=="M" & age==79 | |
| gen surv_ginsburg=1 if gnd=="F" & age==85 | |
| foreach var of varlist surv_* { | |
| replace `var' = `var'[_n-1] * ( 1 - mortrate_pred[_n-1] ) if mi(`var') & gnd[_n-1]==gnd | |
| } | |
| * Move from ages to years | |
| foreach j in gorsuch kavanaugh roberts alito thomas kagan sotomayor breyer ginsburg { | |
| preserve | |
| keep surv_`j' | |
| drop if mi(surv_`j') | |
| gen year=_n+2017 | |
| order year | |
| tempfile s_`j' | |
| save `s_`j'' | |
| restore | |
| } | |
| use `s_gorsuch', clear | |
| foreach j in kavanaugh roberts alito thomas kagan sotomayor breyer ginsburg { | |
| merge 1:1 year using `s_`j'', nogen | |
| } | |
| * Compute combined survival prob | |
| gen surv_conservative_block = surv_gorsuch*surv_kavanaugh*surv_roberts*surv_alito*surv_thomas | |
| gen surv_liberal_block = surv_kagan*surv_sotomayor*surv_breyer*surv_ginsburg | |
| * Switch from fractions to percentages | |
| foreach var of varlist surv_* { | |
| replace `var'=`var'*100 | |
| } | |
| * Plot | |
| /* | |
| sum surv_gorsuch if surv_gorsuch<50 | |
| local first_surv_lt50 = r(max) | |
| sum year if surv_gorsuch == `first_surv_lt50' | |
| assert r(N)==1 | |
| local first_year_lt50 = r(mean) | |
| tw (area surv_gorsuch year if surv_gorsuch>=`first_surv_lt50', lw(none) color(maroon)) /// | |
| (line surv_gorsuch year, lc(maroon)) /// | |
| (scatteri `first_surv_lt50' 2018 `first_surv_lt50' `first_year_lt50', c(l) lc(gs8) ms(i) lw(medthick)) /// | |
| (scatteri `first_surv_lt50' `first_year_lt50', mc(gs8)) /// | |
| , /// | |
| ylab(0(50)100) /// | |
| xlab(2018 `first_year_lt50') /// | |
| legend(off) /// | |
| title(Gorsuch) xtitle("") ytitle("") | |
| */ | |
| cap graph drop _all | |
| foreach j in conservative_block liberal_block gorsuch kavanaugh roberts alito thomas kagan sotomayor breyer ginsburg { | |
| sum surv_`j' if surv_`j'<50 | |
| local first_surv_lt50 = r(max) | |
| sum year if round(surv_`j',0.001) == round(`first_surv_lt50',0.001) | |
| assert r(N)==1 | |
| local first_year_lt50 = r(mean) | |
| if inlist("`j'","kagan","liberal_block","sotomayor","breyer","ginsburg") local c midblue | |
| else local c cranberry | |
| tw (area surv_`j' year if surv_`j'>=`first_surv_lt50', lw(none) color(`c')) /// | |
| (line surv_`j' year, lc(`c')) /// | |
| (scatteri `first_surv_lt50' 2018 `first_surv_lt50' `first_year_lt50', c(l) lc(gs8) ms(i) lw(medthick)) /// | |
| (scatteri `first_surv_lt50' `first_year_lt50', mc(gs8)) /// | |
| , /// | |
| ylab(0(50)100) /// | |
| xlab(`first_year_lt50') /// | |
| legend(off) /// | |
| title(`=strproper("`j'")') xtitle("") ytitle("") /// | |
| name(`j') | |
| } | |
| * Output graphs | |
| graph combine ginsburg breyer sotomayor kagan, rows(1) /// | |
| xsize(6) ysize(2) iscale(*2.5) | |
| graph export "liberal_justices.png", replace | |
| graph combine thomas alito roberts kavanaugh gorsuch, rows(1) /// | |
| xsize(7.5) ysize(2.1) iscale(*3) | |
| graph export "conservative_justices.png", replace | |
| graph export "liberal_block.png", name(liberal_block) replace | |
| graph export "conservative_block.png", name(conservative_block) replace |
Sign up for free
to join this conversation on GitHub.
Already have an account?
Sign in to comment
Inspired by FiveThirtyEight: How Long Will The Supreme Court’s Conservative Bloc Survive?, which approximates U.S. supreme court justices' survival probabilities CDC mortality data by Age x Sex x Race.
Supreme court justices have incomes above the 97th income percentile, and the richest Americans live much longer than the poorest Americans (Chetty et al, JAMA 2016). This gist approximates U.S. supreme court justices' survival probabilities using Health Inequality Project mortality data by Age x Sex x Income.
If the justices' mortality rates resemble those of Americans with similar incomes, they will live longer than an average American, and considerably longer than suggested by the original FiveThirtyEight calculations.
Resulting figures: