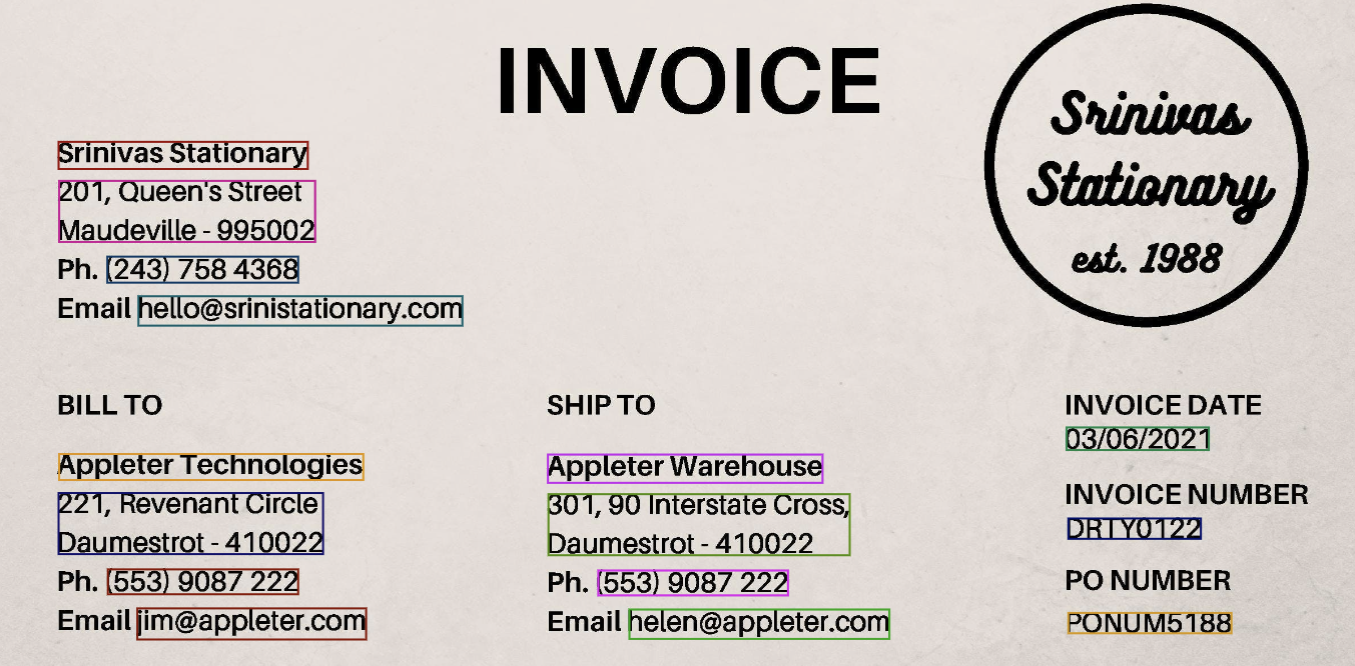
After processing any given file, the Nanonets model ascertains bounding boxes for each value to be detected.
This is the box that defines the boundaries of the text that was detected. As an example, we can see in this particular processed invoice that for each value detected, there is a rectangular box drawn around it. Each box is a bounding box
In our JSON outputs, we share information to calculate the coordinates of the bounding boxes as well. Let us now see how this can be done.
Below is a sample of the JSON schema that we receive when we process any file. The below JSON schema is incomplete but intentionally so for the purpose of simplicity. All the labels highlighted here are sufficient for this discussion.
{
	"message": "Success",
	"result": [{
		"message": "success",
		"input": "33.6547728_-117.7801709_8.pdf",
		"prediction": [...]
             ...
             }]
    ...
}
The label prediction contains a list of all the predicted values that are being detected within the page. For the above image, the prediction label would contain this list (once again, truncated for simplicity)
[
    {
        "label": "shipping",
        "ocr_text": "15",
        "score": 0.937435,
        "xmin": 2236,
        "xmax": 2287,
        "ymin": 2230,
        "ymax": 2265
    },
    {
        "label": "seller_email",
        "ocr_text": "hello@srinistationary.com",
        "score": 0.968088,
        "xmin": 271,
        "xmax": 843,
        "ymin": 683,
        "ymax": 735
    },
    {
        "label": "po_number",
        "ocr_text": "PONUM5188",
        "score": 0.98099923,
        "xmin": 1913,
        "xmax": 2201,
        "ymin": 1243,
        "ymax": 1279
    }
    ...
]
Let us now understand how this has been structured. For every single value being detected, a dictionary is added to the list prediction. Each of these dictionaries has the following structure
    {
        "label": "label_name",
        "ocr_text": "extracted_value",
        "score": 0.98099923,
        "xmin": 1913,
        "xmax": 2201,
        "ymin": 1243,
        "ymax": 1279
    }
For the label label_name, we also receive four coordinates - xmin, xmax, ymin, ymax. Let us now understand how we can use this to find the locations of the vertices of each bounding box.
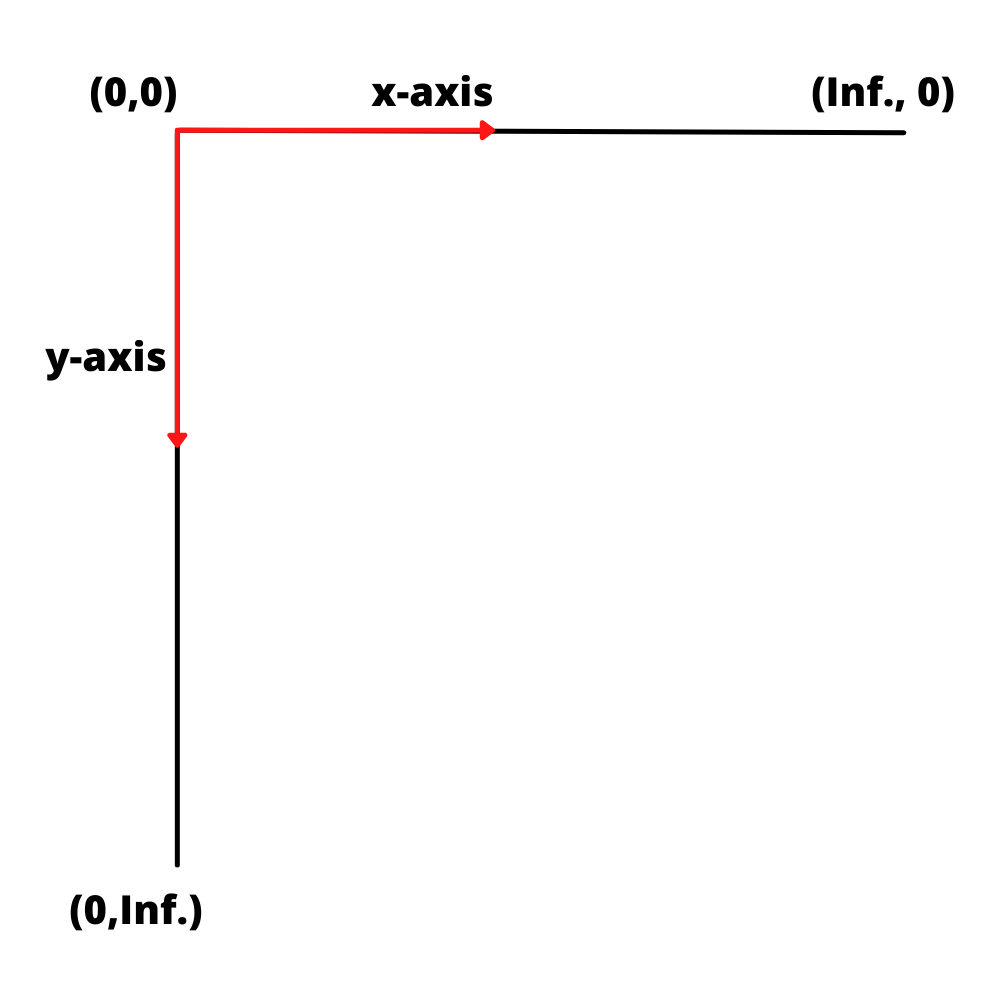
In Nanonets, the coordinate system has origin at the top left corner, i.e. (0,0) lies at the top left corner of the page. The positive x-axis moves from the origin towards the right, while the positive y-axis moves from the origin to the bottom of the page
Given the four coordinate values, xmin, xmax, ymin, ymax, we can find the bounding box by setting the distance from the origin. The four coordinates will then be (xmin, ymin), (xmin, ymax),(xmax, ymin) and (xmax, ymax) and these coordinates have been highlighted in the image below for your reference.
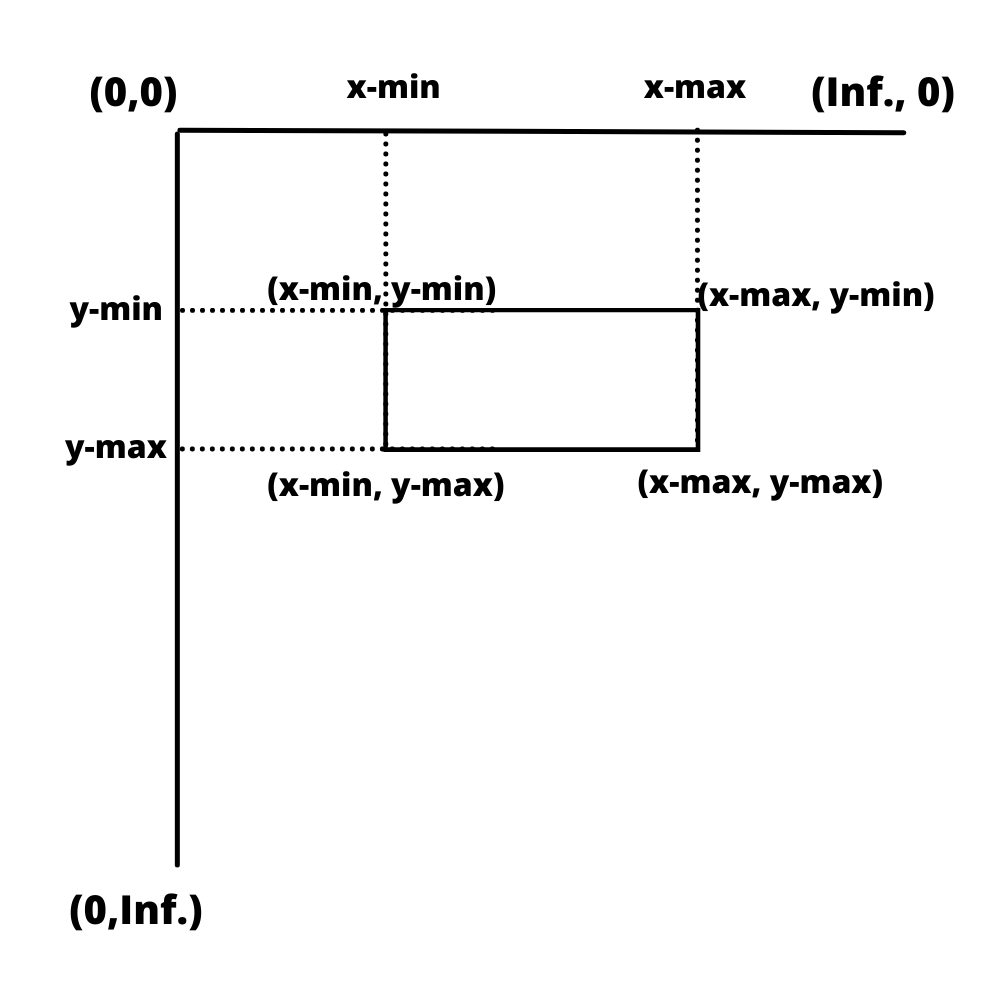
Using these values, we can find the respective coordinates of every bounding box.