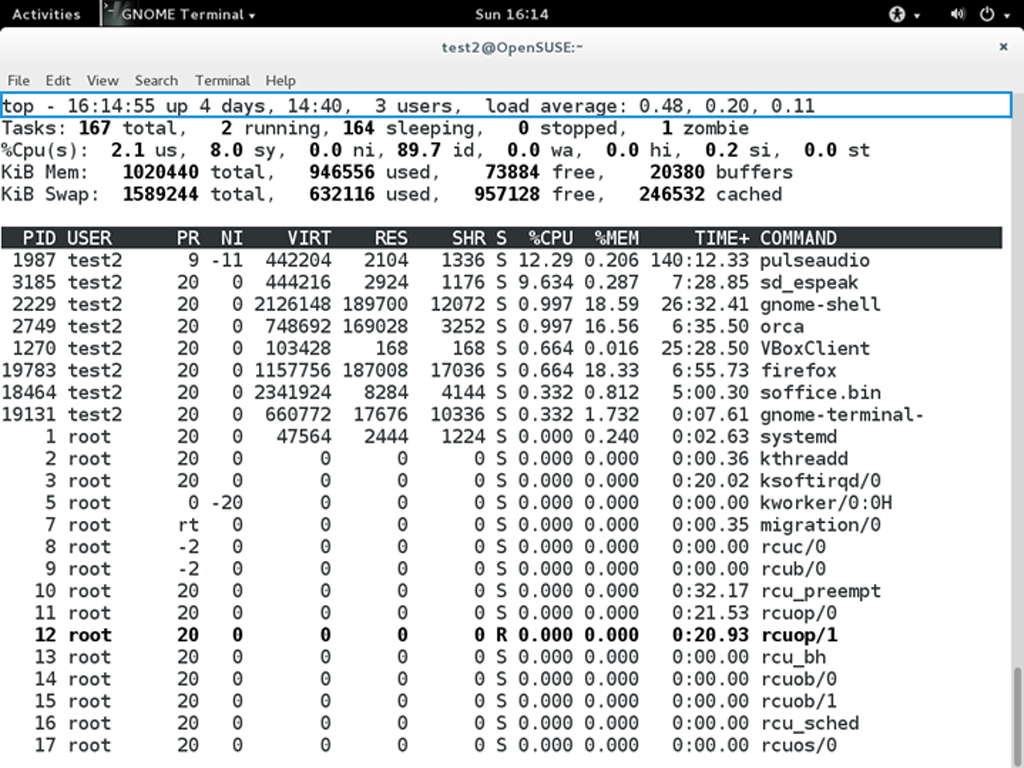
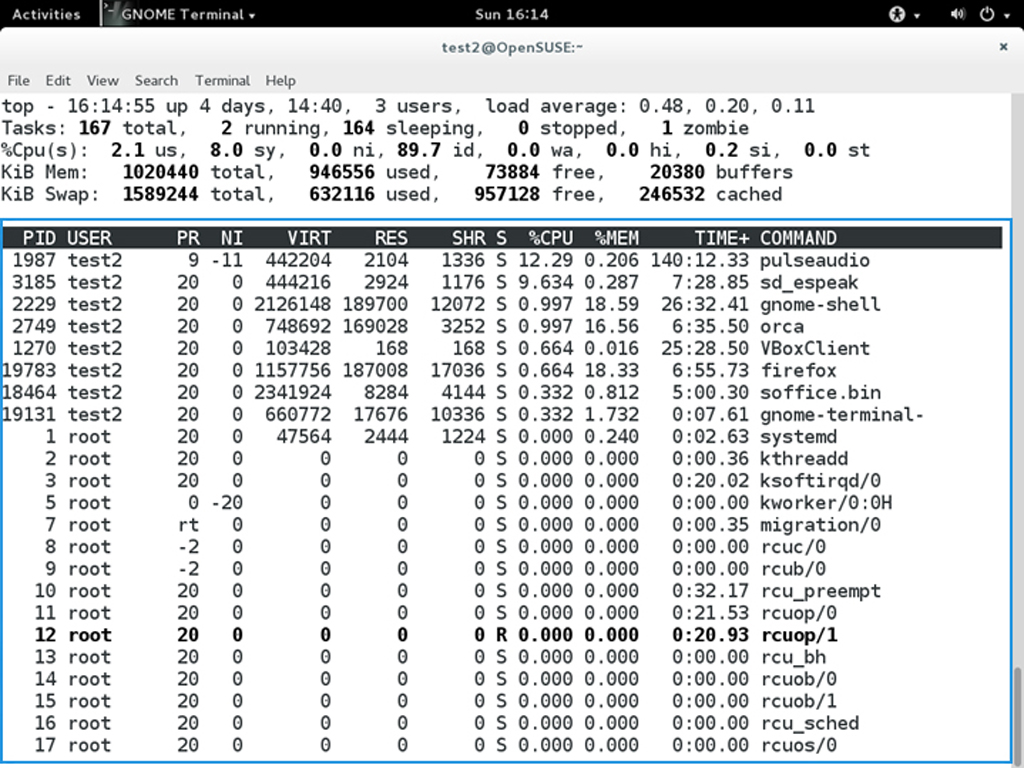
- Monitor the system performance live over time.
- A quick summary of what is happening in the system including:
- How long the system has been up
- How many users are logged on
- What is the load average
- Determines how busy the system is.
- 1.00 per CPU: a fully subscribed, but not overloaded.
- above 1.00 per CPU: processes are competing for CPU time.
- Note: If the load average is very high, it might indicate that the system is having a problem, such as a runaway process (a process in a non-responding state).
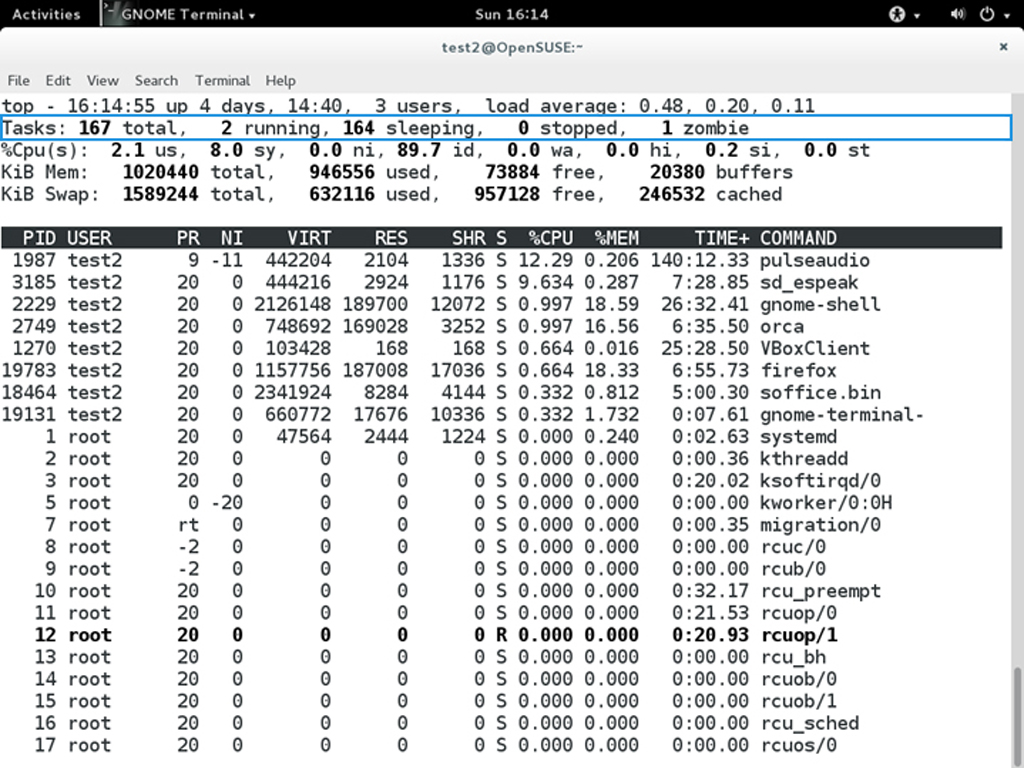
- The number of processes:
- total
- running
- sleeping
- stopped
- zombie
- Comparing the number of running processes with the load average helps determine if the system has reached its capacity or perhaps a particular user is running too many processes.
- The stopped processes should be examined to see if everything is running correctly.
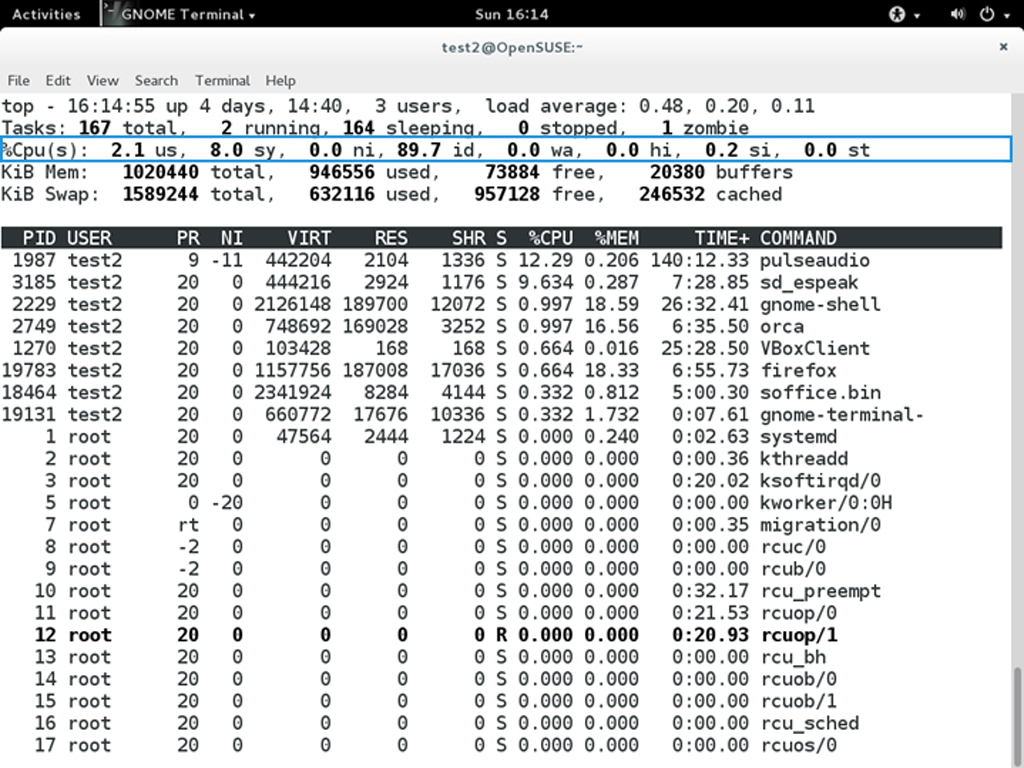
- How the CPU time is being divided between the users (us) and the kernel (sy) by displaying the percentage of CPU time used for each.
- The percentage of user jobs running at a lower priority (niceness - ni) is then listed.
- Idle mode (id) should be low if the load average is high, and vice versa.
- The percentage of jobs waiting (wa) for I/O is listed.
- Interrupts include the percentage of hardware (hi) vs. software interrupts (si).
- Steal time (st) is generally used with virtual machines, which has some of its idle CPU time taken for other uses.
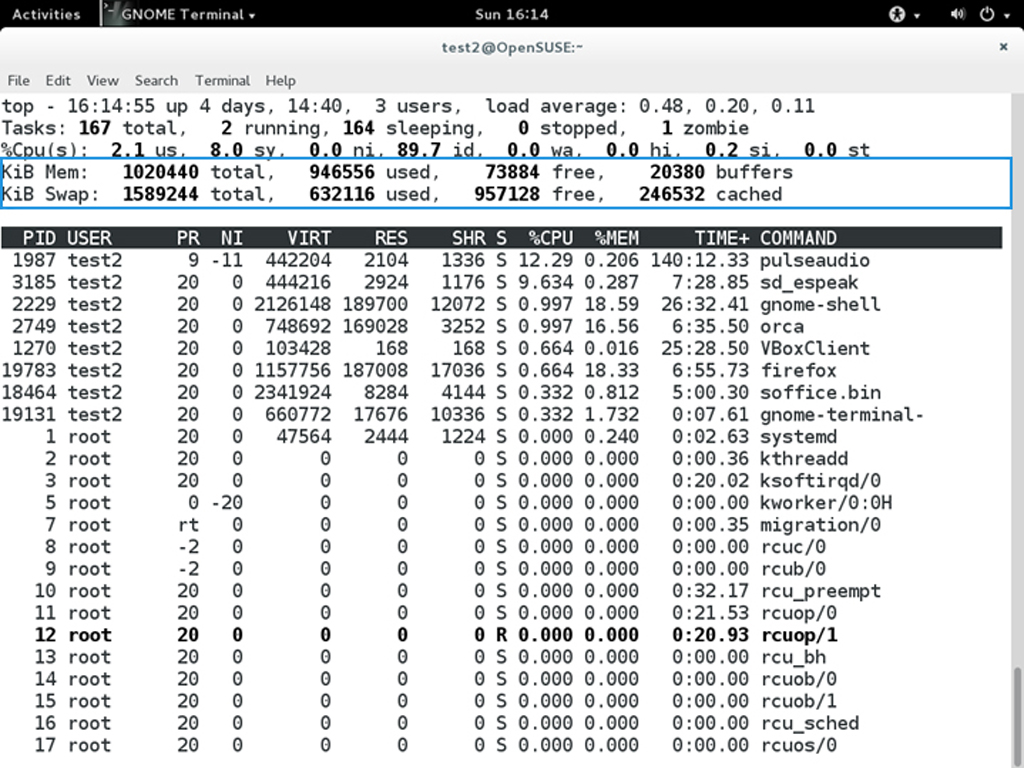
- memory usage:
- Physical memory (RAM)
- Swap space
- Temporary storage space on the hard drive
- Once the physical memory is exhausted, the system starts using swap space as an extended memory pool
- Note: since accessing disk is much slower than accessing memory, this will negatively affect system performance.
- Note: If the system starts using swap often, you can add more swap space. However, adding more physical memory should also be considered.
- Information about a process
- By default, processes are ordered by highest CPU usage.
- Process Identification Number (PID)
- Process owner (USER)
- Priority (PR) and nice values (NI)
- Virtual (VIRT), physical (RES), and shared memory (SHR)
- Status (S)
- Percentage of CPU (%CPU) and memory (%MEM) used
- Execution time (TIME+)
- Command (COMMAND)
- Besides reporting information, top can be utilized interactively for monitoring and controlling processes.
- While top is running in a terminal window you can enter single-letter commands to change its behaviour.
- e.g., you can view the top-ranked processes based on CPU or memory usage. If needed, you can alter the priorities of running processes or you can stop/kill a process.
| command | output |
|---|---|
| t | Display or hide summary information (rows 2 and 3) |
| m | Display or hide memory information (rows 4 and 5) |
| A | Sort the process list by top resource consumers |
| r | Renice (change the priority of) a specific processes |
| k | Kill a specific process |
| f | Enter the top configuration screen |
| o | Interactively select a new sort order in the process list |