population = rnorm(1000, mean = 10, sd = 1)

samples = replicate(100, sample(population, size = 10))

ext.confid.interval = function(s, mu){
confid.intervals = apply(s, 2, t.test, mu = mu)
n.samples = dim(s)[2]
lower.bound = vapply(confid.intervals, function(x) x$conf.int[1], FUN.VALUE = 100)
upper.bound = vapply(confid.intervals, function(x) x$conf.int[2], FUN.VALUE = 100)

result = data.frame('sample.no' = seq(n.samples),
'lower.bound' = lower.bound,
'upper.bound' = upper.bound,
'x' = seq(n.samples),
'x.end' = seq(n.samples))

return(result)
}

plot.data = ext.confid.interval(samples, mu = 12)

library(ggplot2)

ggplot() +
geom_segment(data = plot.data,
aes(x = x,
xend = x.end,
y = lower.bound,
yend = upper.bound,
color = 'Confidence Interval')) +
geom_abline(aes(slope = 0, intercept = 10, color = 'True Mean')) +
scale_color_manual(values = c('Confidence Interval' = '#4682b4', 'True Mean'= '#000000'))+
labs(x='samples', y = 'confidence interval') +
theme(legend.title = element_blank(),
legend.position = 'top')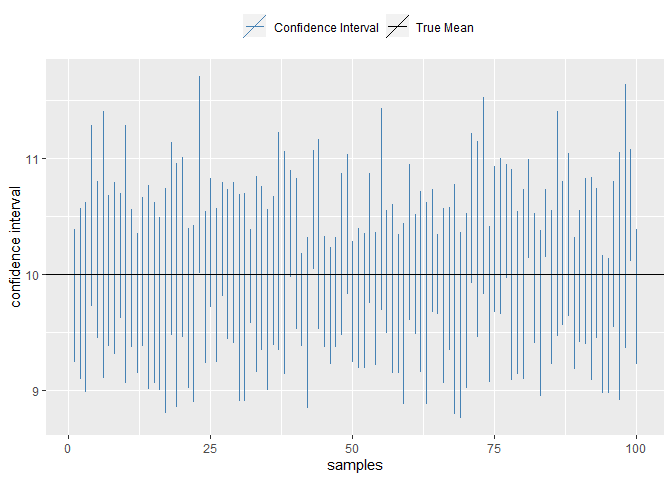
#fraction of confidence interval which don't contain true mean
numerator = nrow(plot.data[
which(
plot.data$lower.bound > 10 |
plot.data$upper.bound < 10
),
])

fract = numerator/nrow(plot.data)
fract
#> [1] 0.05
