Created
March 9, 2022 07:58
-
-
Save mrcaseb/7e74afef42eb985c66d1341d407b6dbb to your computer and use it in GitHub Desktop.
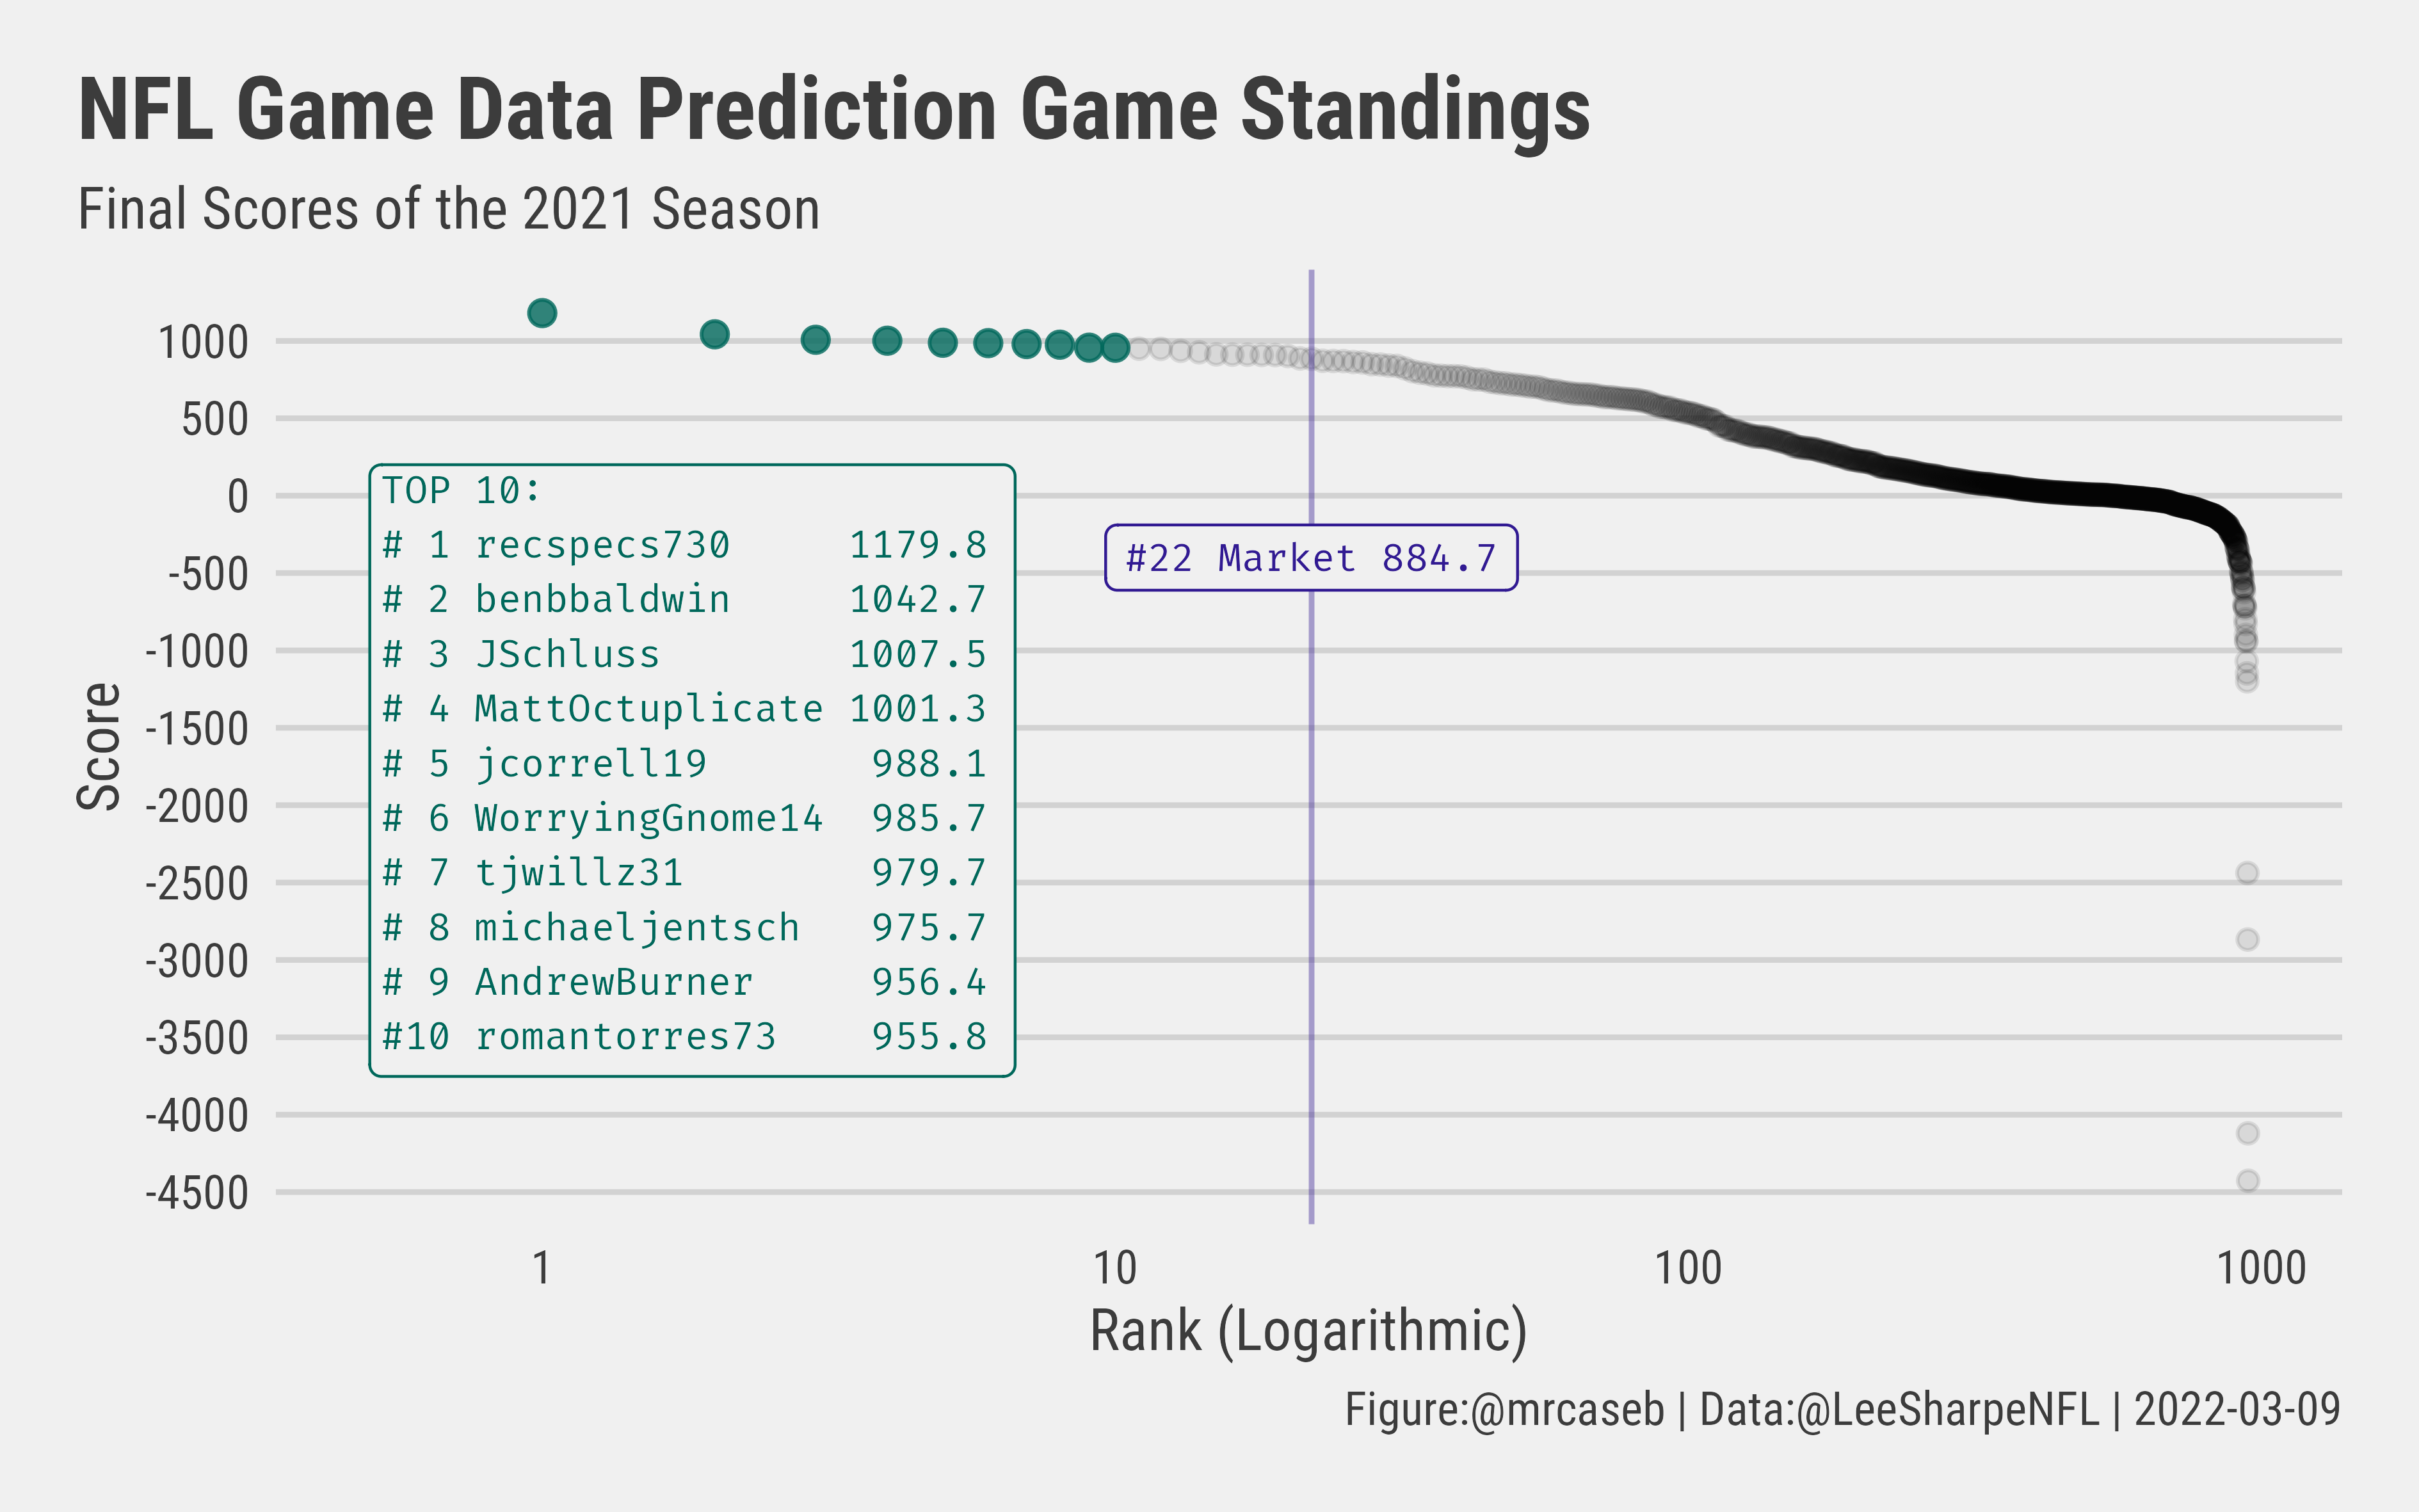
Code to recreate prediction game plot from https://twitter.com/mrcaseb/status/1493242514270261250
This file contains bidirectional Unicode text that may be interpreted or compiled differently than what appears below. To review, open the file in an editor that reveals hidden Unicode characters.
Learn more about bidirectional Unicode characters
| library(dplyr, warn.conflicts = FALSE) | |
| library(ggplot2) | |
| preds <- nflreadr::csv_from_url("https://raw.githubusercontent.com/nflverse/nfldata/master/data/predictions.csv") | |
| g <- nflreadr::load_schedules(2021) | |
| points <- preds |> | |
| filter(prediction != 50) |> | |
| left_join(g |> select(game_id, week, result), by = "game_id") |> | |
| mutate( | |
| m = case_when( | |
| week <= 18 ~ 1, | |
| week == 19 ~ 2, | |
| week == 20 ~ 3, | |
| week == 21 ~ 4, | |
| week == 22 ~ 5 | |
| ), | |
| r = ifelse(result >= 0, 1, 0), | |
| points = m * (25 - (100 * (prediction / 100 - r)^2)), | |
| points = ifelse(result == 0, 0, points) | |
| ) |> | |
| group_by(screen_name) |> | |
| summarise(p = sum(points, na.rm = TRUE) |> round(1)) |> | |
| ungroup() |> | |
| arrange(desc(p)) |> | |
| mutate(xaxis = 1:n()) | |
| top <- points |> | |
| slice_max(p, n = 10) |> | |
| mutate(string = glue::glue("#{format(xaxis)} {format(screen_name)} {format(p, nsmall = 1)}")) | |
| rest <- points |> filter(!screen_name %in% c(top$screen_name)) | |
| market <- points |> filter(screen_name == "Market") | |
| highlight_col <- "#00685BFF" | |
| market_col <- "#311A92FF" | |
| p <- ggplot(NULL, aes(x = xaxis, y = p)) + | |
| geom_point(data = rest, alpha = 0.1) + | |
| geom_point(data = top, alpha = 0.8, color = highlight_col, size = 2) + | |
| geom_vline(xintercept = market$xaxis, alpha = 0.4, color = market_col, size = 0.5) + | |
| scale_x_log10("Rank (Logarithmic)") + | |
| scale_y_continuous("Score", breaks = scales::breaks_pretty(n = 15)) + | |
| ggthemes::theme_fivethirtyeight(base_size = 11, base_family = "Roboto Condensed") + | |
| annotate( | |
| "label", x = market$xaxis, y = -400, label = paste0("#", market$xaxis, " Market ", market$p), | |
| color = market_col, family = "Fira Code", fill = "#F0F0F0", size = 2.5 | |
| ) + | |
| annotate( | |
| "label", x = 0.5, y = 200, hjust = 0, vjust = 1, | |
| label = glue::glue("TOP {nrow(top)}:\n", glue::glue_collapse(top$string, sep = "\n")), | |
| color = highlight_col, family = "Fira Code", fill = "#F0F0F0", size = 2.5 | |
| ) + | |
| labs( | |
| title = "NFL Game Data Prediction Game Standings", | |
| subtitle = "Final Scores of the 2021 Season", | |
| caption = glue::glue("Figure:@mrcaseb | Data:@LeeSharpeNFL | {lubridate::today()}") | |
| ) + | |
| theme( | |
| plot.title.position = "plot", | |
| axis.title = element_text(), | |
| panel.grid.major.x = element_blank() | |
| ) + | |
| NULL | |
| ggsave("prediction_game.png", plot = p, width = 16, height = 10, units = "cm", dpi = 600) |
Sign up for free
to join this conversation on GitHub.
Already have an account?
Sign in to comment
Output