Last active
June 28, 2022 17:51
-
-
Save nelsondev19/1c0f7930aab755223de7f971f3aca94b to your computer and use it in GitHub Desktop.
How to monitor PostgreSQL with Prometheus and Grafana | Docker
This file contains bidirectional Unicode text that may be interpreted or compiled differently than what appears below. To review, open the file in an editor that reveals hidden Unicode characters.
Learn more about bidirectional Unicode characters
| version: "3.9" | |
| services: | |
| grafana: | |
| image: grafana/grafana | |
| ports: | |
| - 3000:3000 | |
| prometheus: | |
| image: prom/prometheus | |
| ports: | |
| - 9090:9090 | |
| volumes: | |
| - ./prometheus.yml:/etc/prometheus/prometheus.yml:ro | |
| postgres: | |
| image: postgres:latest | |
| ports: | |
| - 5432:5432 | |
| volumes: | |
| - ./backup:/var/lib/postgresql/data | |
| environment: | |
| POSTGRES_PASSWORD: postgrespassword | |
| POSTGRES_DB: shop | |
| postgres-exporter: | |
| image: prometheuscommunity/postgres-exporter | |
| ports: | |
| - 9187:9187 | |
| environment: | |
| DATA_SOURCE_NAME: "postgresql://postgres:postgrespassword@postgres:5432/shop?sslmode=disable" | |
| links: | |
| - postgres | |
| - prometheus | |
This file contains bidirectional Unicode text that may be interpreted or compiled differently than what appears below. To review, open the file in an editor that reveals hidden Unicode characters.
Learn more about bidirectional Unicode characters
| global: | |
| scrape_interval: 15s | |
| evaluation_interval: 15s | |
| scrape_configs: | |
| - job_name: prometheus | |
| static_configs: | |
| - targets: ["localhost:9090"] | |
| - job_name: postgres-exporter | |
| static_configs: | |
| - targets: ["postgres-exporter:9187"] |
Sign up for free
to join this conversation on GitHub.
Already have an account?
Sign in to comment
3.Run Docker Compose
4.Check status of Prometheus and Redis Exporter
5.Visit Grafana Dashboard
Default
User: admin
Password: admin
6.Add data source
Save and test
7.Import PostgreSQL Dashboard for Prometheus
For this we will use a Dashboard created by the community
https://grafana.com/grafana/dashboards/9628
8.Import JSON of code
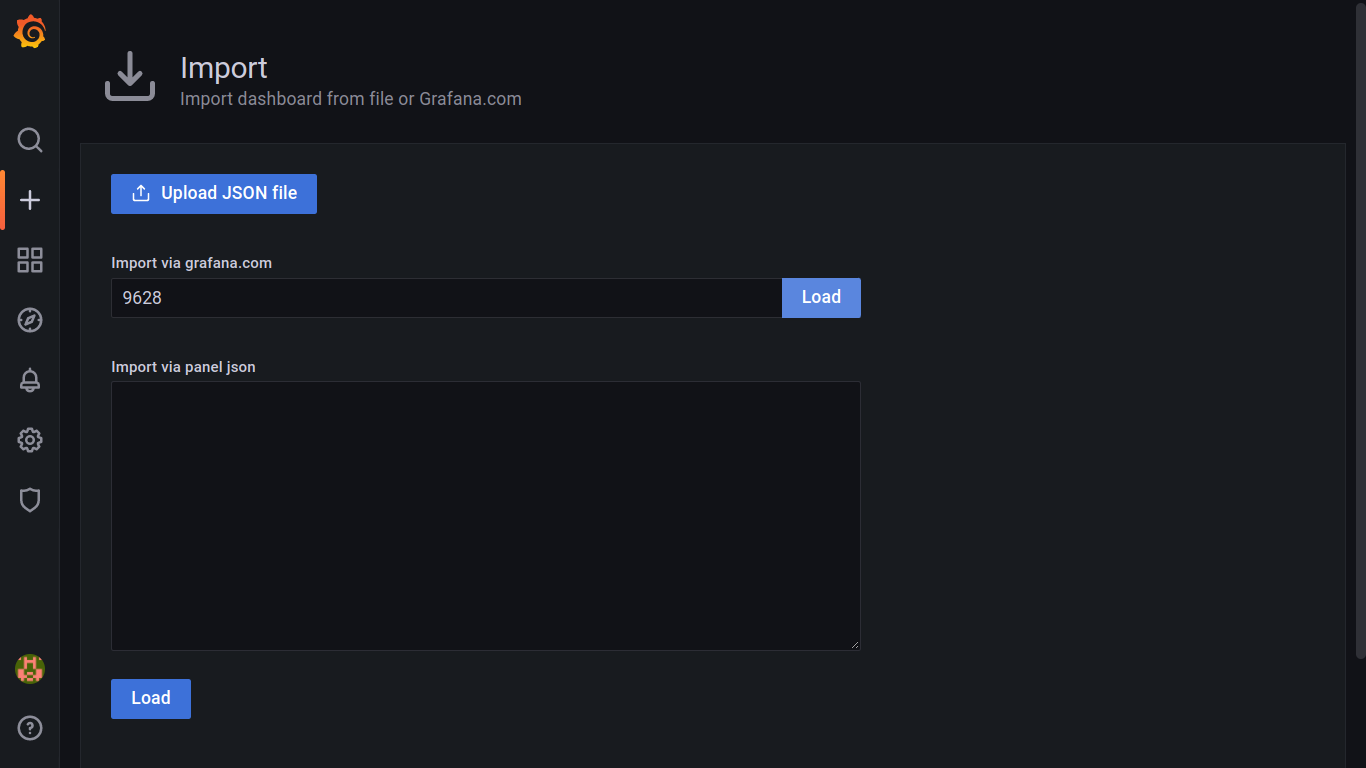
Code: 9628
9.Dashboard