Simple online analytics built on top of our ES HTTP passthrough.
Nuxeo Data Visualization elements to expose a simple declarative DSL, ie:
  <nuxeo-repository-data ecm-primary-type="Note"
                         where='[{"range": {"dc:created": {"gte": startDate, "lte": endDate}}}]'
                         grouped-by="dc:creator"
                         data="{{data}}">
</nuxeo-repository-data>- nuxeo-repository-data
- nuxeo-audit-data
- nuxeo-search-data (from audit)
- nuxeo-workflow-data (from audit_wf)
Problem: Querying the application's ES cluster can be a big performance hit
Possible solutions
- Online analytics solution
- Dedicated ES index
- Precompute the statistics (no requirement for realtime stats)
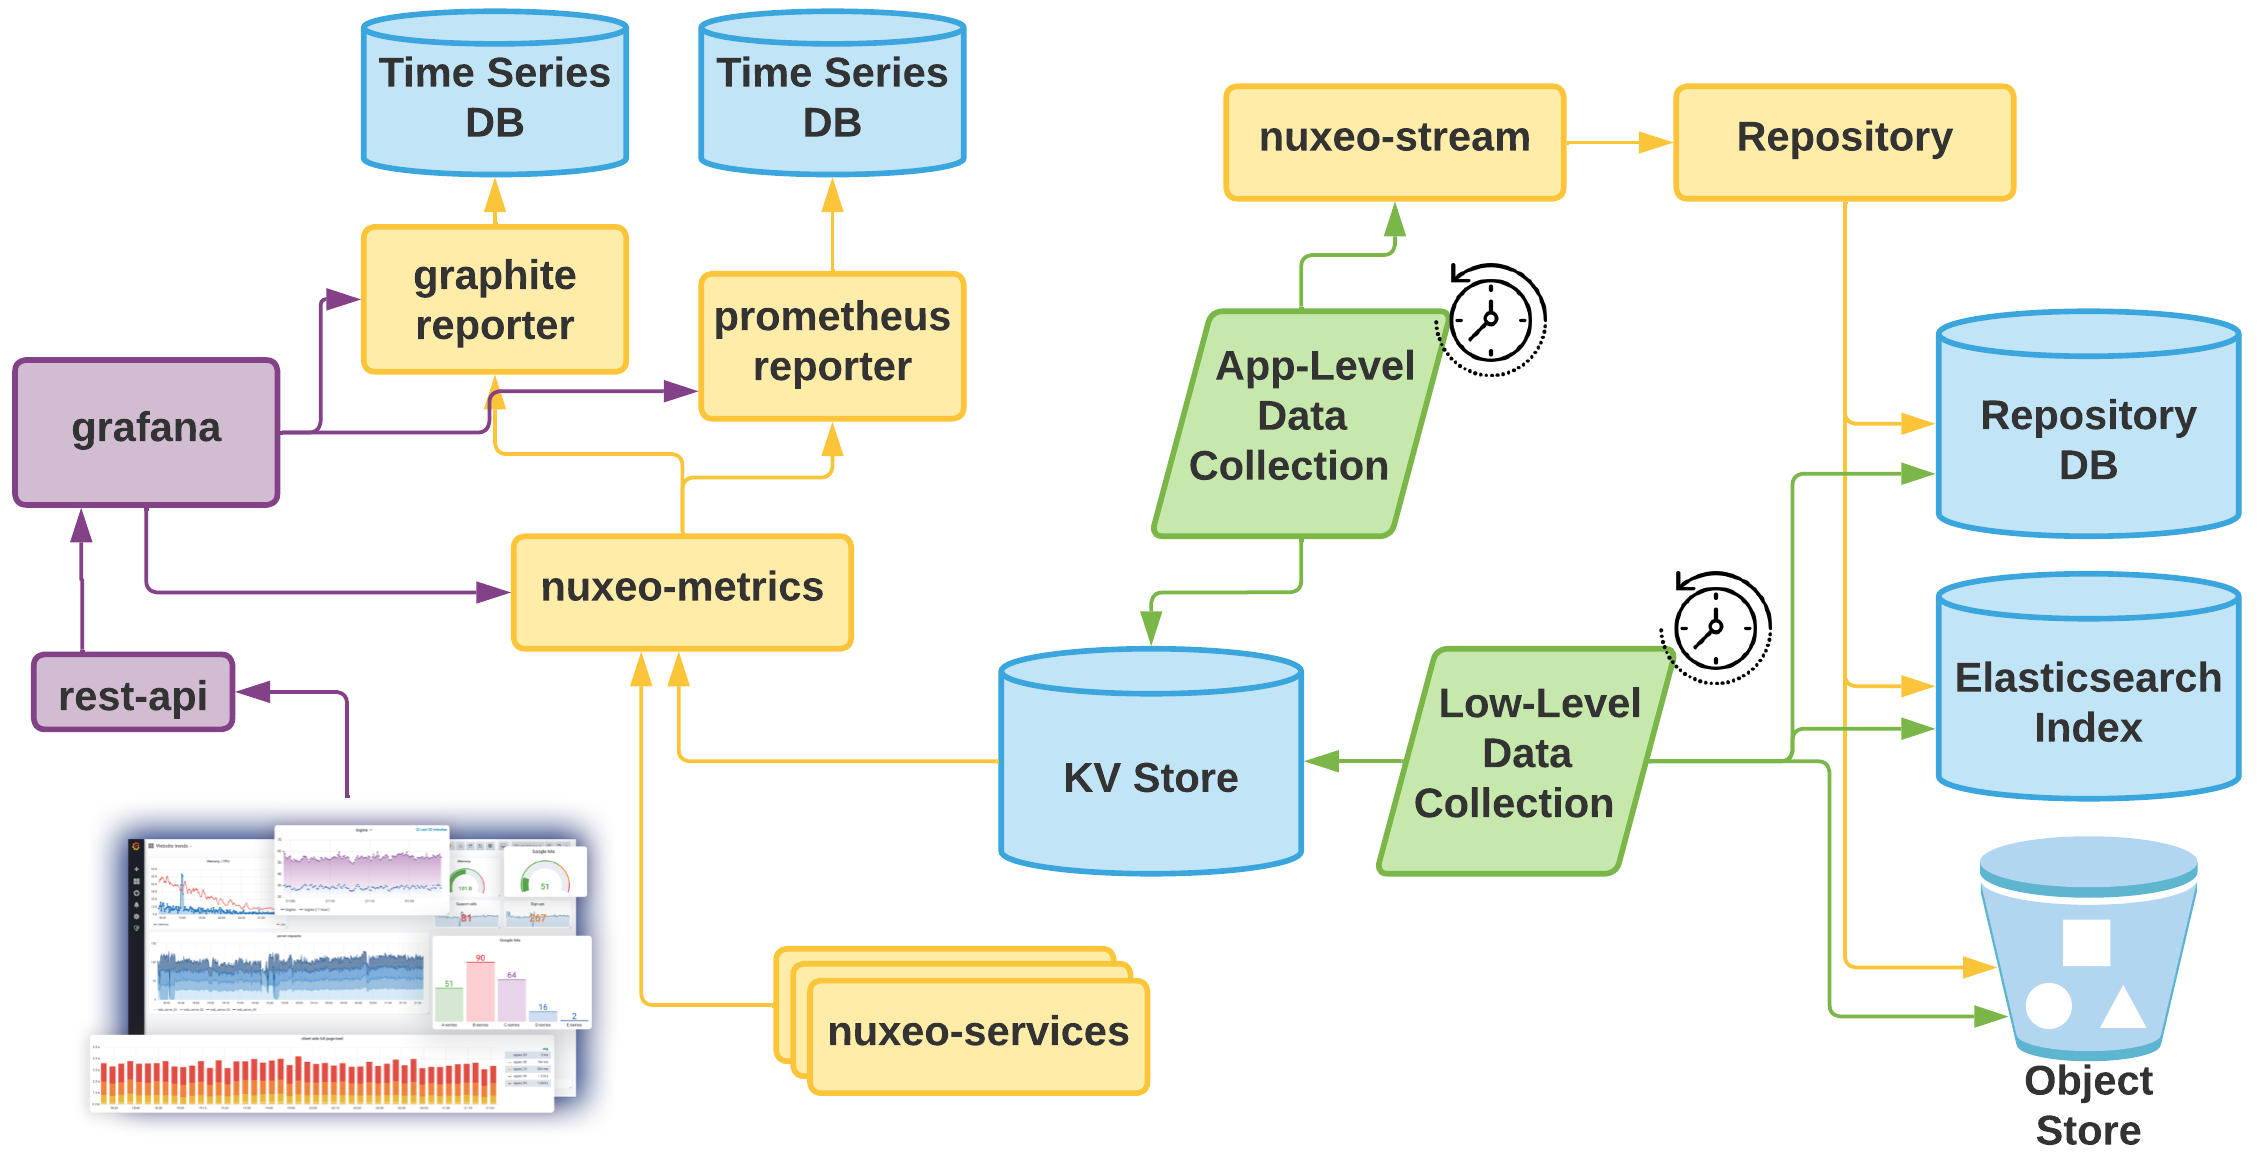
It's all about observability : Metrics + Events + Logs + Traces
We already have nuxeo-metrics (using Dropwizard's Metrics) and several reporters (Datadog, Graphite, JMX, Prometheus, Stackdriver, ...)
Multiple immediate usages (Analytics, APM, Billing, etc...)
- Compute metrics asynchronously => they should be low overhead to collect
- Store then in a KV store => cached and available to the cluster
- Can have multiple computations at different levels (application / low)
Sample metrics
-
Repository metrics (VCS/DBS, ES, PGSQL/MongoDB/...):
- Total number of documents
- Total number of deleted documents
-
Storage metrics (Binary manager, GCS/S3/...):
- Total GB
- Total GB deleted
-
Workload metrics (Workmanager, K8s, ...):
- "Processed" documents
- "Processed" GB
- Worker pool size, CPU usage, etc..
-
Usage metrics (Tomcat, Apache, Ingress, ...):
- Number of active users
- Inbound / outbound traffic
Telemetry refers to the collection of metrics over time, so usually using a Time-series DB.
- Graphite, Prometheus, AWS Cloud Watch, Google Cloud Monitoring, etc..
Need a holistic solution that allows fetching and visualizing the data as well as building custom dashboards.
Need to embed dashboards in Web UI.
- Grafana: shareable dashboard and panels + REST API