Also available on Odysee: https://odysee.com/@nikooo777:5/o_direct:3
I work at LBRY and I'm a DevOps and Infrastructure Engineer there.
One of my tasks is to develop and improve video delivery to our players over at https://odysee.com.
While this seems like a rather easy task, it actually becomes a very complex one as traffic grows and usage spreads across the world.
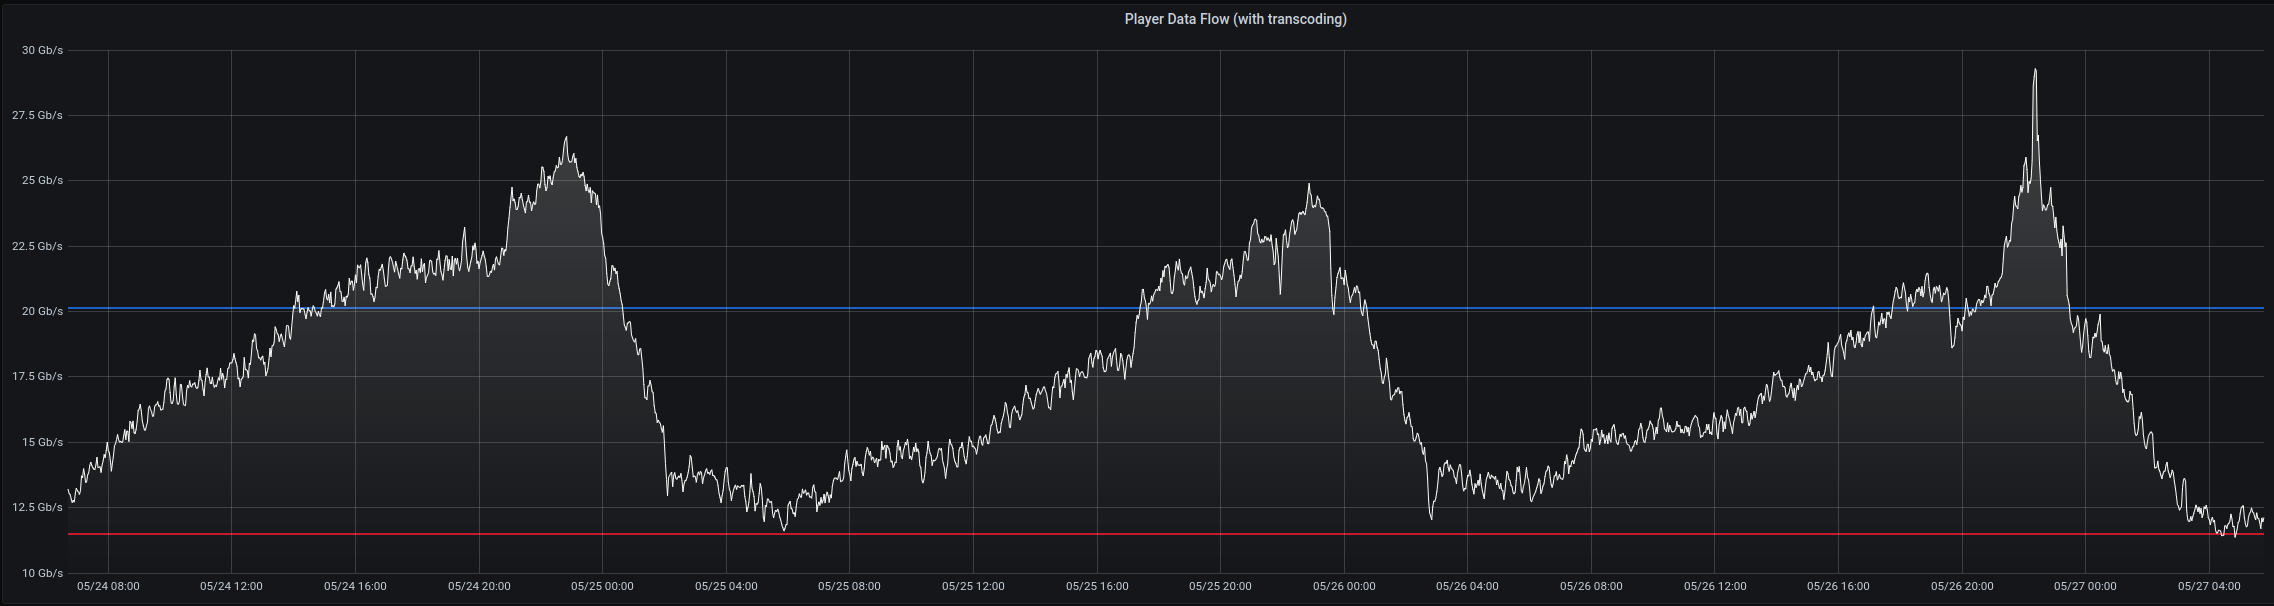
As of today, we see peaks of almost 30Gbps across all regions; to put it in perspective that's as much as ~3 full movies downloaded every second.
Our backend infrastructure ensures that all the videos are fetched from storage, decrypted, put back together, cached, distributed across regions and served to end users.
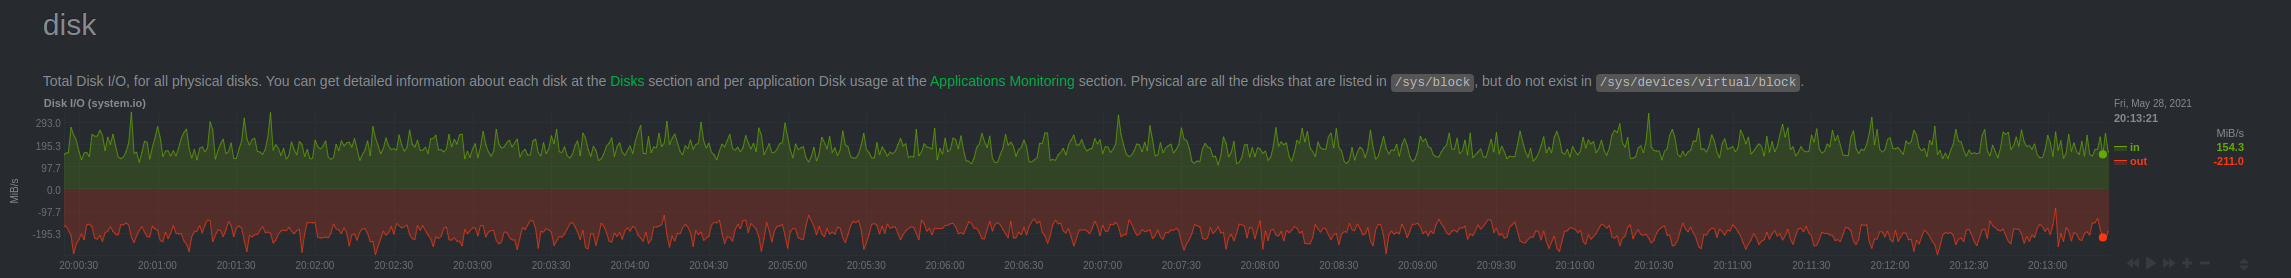
At any given time we are writing and reading several Gigabytes of data to our drives, the use of flash storage drives is almost a must as spinning disks simply cannot keep up.
As any software developer out there knows, programs never really end up working as expected 100% of the time. There are always little bugs hiding behind a corner just waiting to screw your day over (possibly on Friday night or Sunday morning).
Our software is no exception. For months we had to deal with incredibly mysterious crashes and high IOWait lockups that would severely slow down our infrastructure and cause data corruption on videos that would ultimately fail to play for end users.
What was even more frustrating, restarting either the service, the reverse proxy or the whole server would potentially fix the issue for hours or even days before it would show up again.
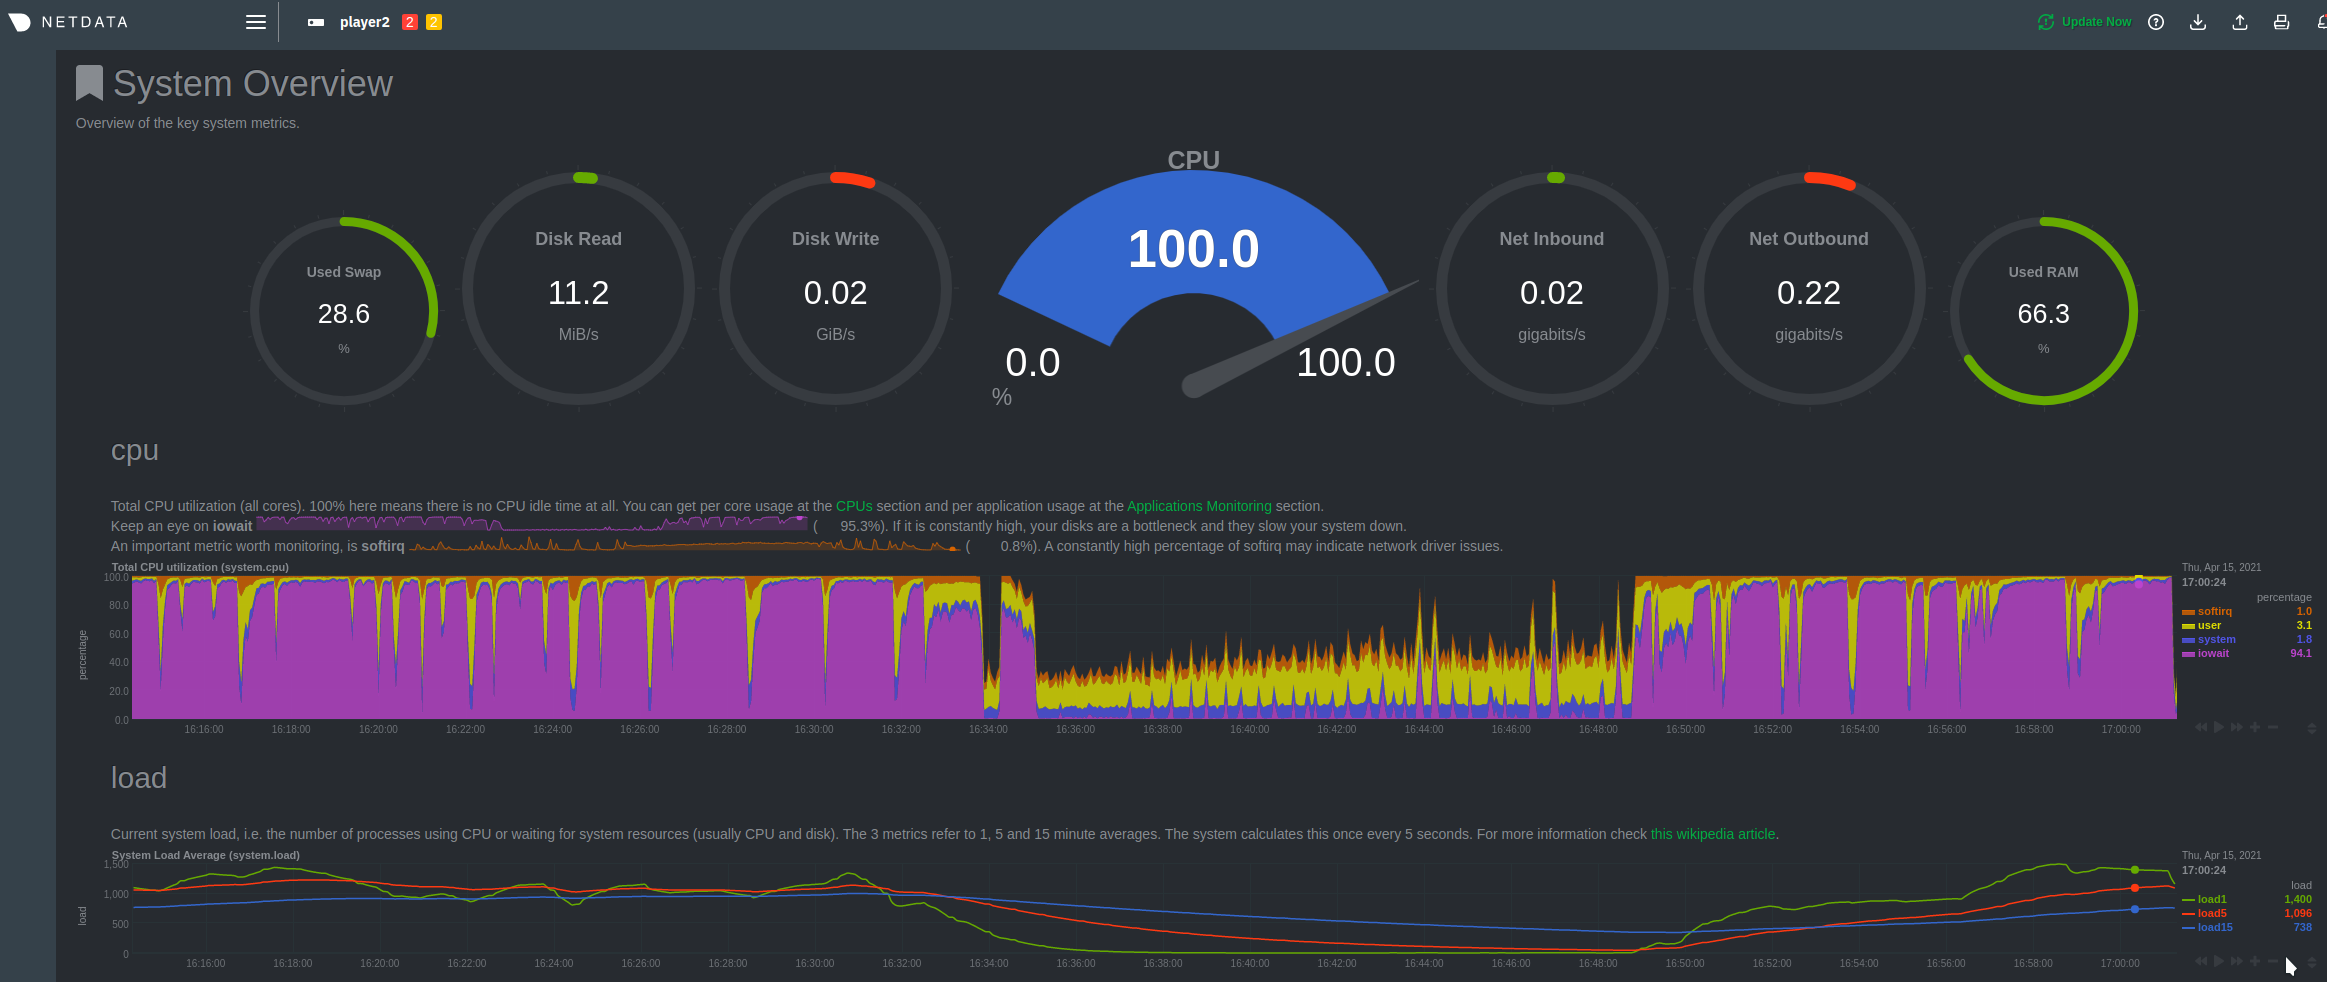
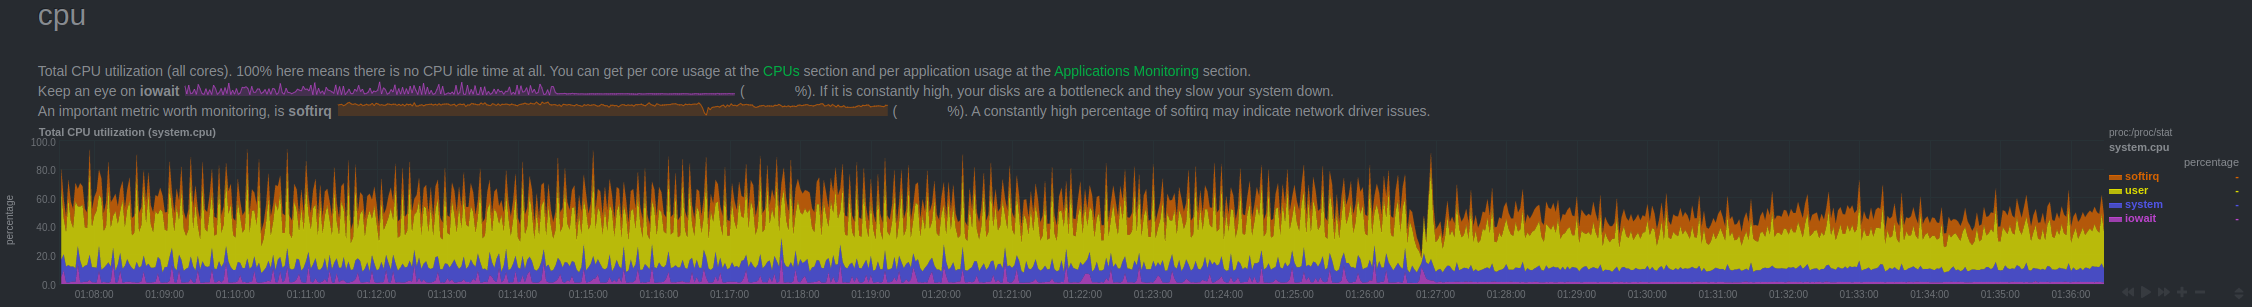
The purple you see above is basically letting us know that disk operations are taking an extremely long time to execute and would keep the CPU busy for as long as the service ran.
Sometimes servers would just stay in a limbo of having very high IOWait and low to no egress traffic, sometimes the service itself would consume so much ram it would trigger the Out Of Memory Killer and simply restart, sometimes the service would literally hang the whole system and the server would have to be hardware rebooted.
Debugging this issue was extremely hard due to a lack of reproducibility. Our player infrastructure is very similar, each server runs the same hardware, we operate on RAID 0 arrays (because redundancy is not a problem) and each server has enough RAM and CPUs to serve content at >4Gbps.
Our first thought was that since only a few servers were showing this odd behavior it had to be a hardware problem. We went ahead and replaced the machines thinking everything would be alright. That lasted a couple of days.
After changing our hardware we thought we must have had bad luck and gotten another faulty server, so we hardware tested our servers, ran full drive checks, ram tests, CPU stress tests, network tests. Everything looked fine.
Is it the software? Since the hardware was not faulty, it had to be a software issue right? We went ahead and refactored or even rewrote parts of code that we thought could be causing these issues. Luck still wasn't on our side, doesn't matter how many parts of the code we'd rewrite.
We should be able to profile our software. We had done that several times and results were always inconclusive. Taking a profile on a production server meant having to wait for one of our servers to fail and being ready with our tools (remember? No local reproductions)
Recently one of our biggest servers in europe started suffering from this very same issue, and it would not be fixed after simply restarting the service. This was bad news, but it was also good news because that meant we had a reliable way of "reproducing" the issue and performing changes to the code (push it to prod!).
One of the first breakthroughs happened a while ago when we tried tracking down what seemed to be a memory leak. It was pretty clear that most of the memory was allocated in the region of code responsible for retrieving a piece of video.
Our first thought was that we were getting too many requests at once and similarly to what happens during a DDoS attack, the server wasn't able to keep up with the load; so the obvious first solution was to implement a queue so that only a certain amount of requests would go through concurrently, the other ones would wait.
While this change seemed to have helped, the issue would eventually reappear. At the time we didn't have the server continuously crashing, so we thought that our transport layer (QUIC/HTTP3) was too heavy on the server as it unnecessarily required all connections between our servers to be encrypted; We implemented another transport layer over HTTP and improved logging and tracing our data. This eliminated a few factors from the equation and led us in the right direction.
Upon being gifted with a server that would stay in a broken state between restarts we started tracing and profiling everything we could and cornered the issue to the region of code responsible for caching the video data on disk after having retrieved it from an upstream server.
Our servers were supposed to serve 200 requests concurrently at most, with each piece of video being 2MB at most, the maximum memory allocation should have been 400MB in RAM while fetching and caching parts, the server was however using up to 30GB before being killed. Was there a routine leak instead?
Key component was eventually found: we were instructing our software to deliver the data to clients immediately and then cache the pieces asynchronously, that meant that even though only 200 requests at a time would be processed, an infinite number of async disk writes could be happening at any time.
We changed our code so that writes would block so that only 200 writes would happen concurrently. This immediately translated in the "memory leak" disappearing, however high IOWait still persisted, and the throughput was still unacceptable.
This however explained why piece of data would randomly corrupt, when a lot of write operations would pile up and never finish, a crash would leave those pieces of data half written to disk. Goodbye time wasted finding and cleaning up corrupted files.
Was the number of concurrent requests too great? We tried lowering it all the way to a single request handled at a time and incredibly enough, writing to disk was still extremely slow and nothing would work.
While the service was running we tried testing our RAID 0 array of 3 NVMe drives using dd:
# dd if=/dev/zero of=/root/testfile bs=2M count=1000
440+0 records in
440+0 records out
922746880 bytes (923 MB, 880 MiB) copied, 183.826 s, 5.0 MB/s
Wow now that's ugly. 5MB/s while writing to an NVMe array is a joke, a USB thumbdrive performs better than that.
How about using a different write strategy?
# dd if=/dev/zero of=/root/testfile bs=2M count=1000 oflag=direct
1000+0 records in
1000+0 records out
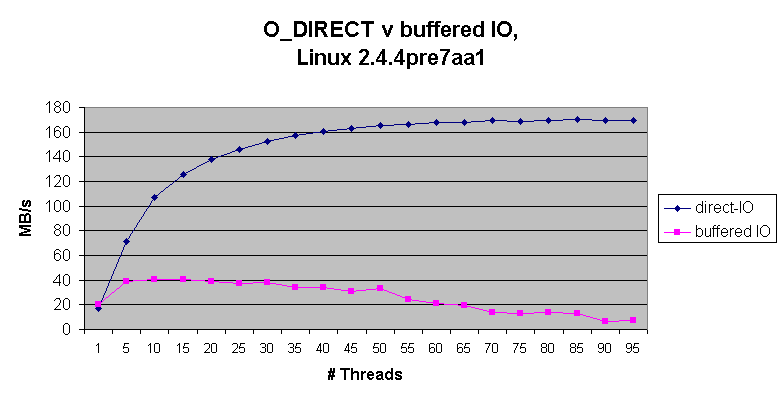
2097152000 bytes (2.1 GB, 2.0 GiB) copied, 1.01906 s, 2.1 GB/sThat's more like it! Why this happens? read about it here
^tl;dr is that the OS/Kernel tries to maintain an in memory cache and for the number of writes going on at the average size of 2MB it all becomes severely inefficient.
Hard to debug problems often have easy solutions. This one certainly did. We quickly located the region of code responsible for writing to disk and changed our code so that we could specify O_DIRECT as write flag.
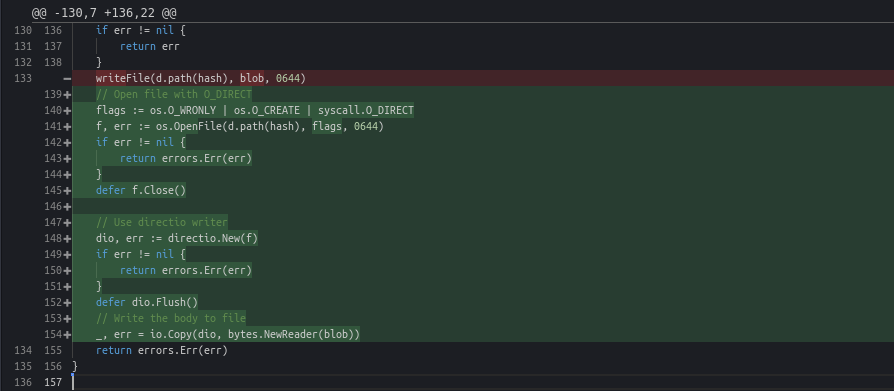
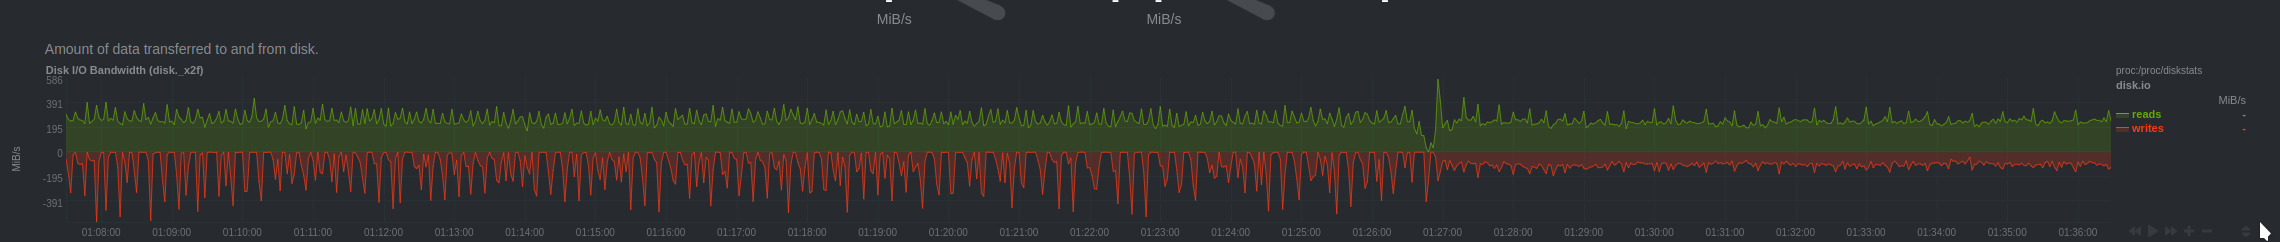
The patch was immediately deployed to all servers and the fix was visible across several charts, here are a couple:
This ordeal was extremely stressful, time-consuming, annoying, detrimental to our users and a blocker to further progress in our software.
The lack of local reproduction made it much harder to debug the issue.
The OS means well, however sometimes it just tries too hard and ends up making things worse, good knowledge of how a system works from the hardware, kernel, OS and application is important in order to crack down on similar bugs.
Most annoying bugs have a simple fix, 99% of the time is spent figuring out which one of the thousands of lines of code is at fault.
LBRY is actively developing products used by million of users all around the world. It doesn't matter what your credentials are, so long as you are motivated and know how to get things done you're likely a good fit! Are you interested in joining our team at LBRY? Consider applying for a position today! Check our open positions here
Writing a lot of objects of a certain size to disk concurrently can benefit from skipping the OS cache layer and instructing the kernel to bypass page caches as well thus writing straight to disk (O_DIRECT flag).
Write speeds can drastically change, this seems to be even more true in the case you're running a striped array of drives (our case).