Created
September 2, 2018 00:29
-
-
Save noamross/8bf1fc5b2f629b3a7e1eb6b4572e8388 to your computer and use it in GitHub Desktop.
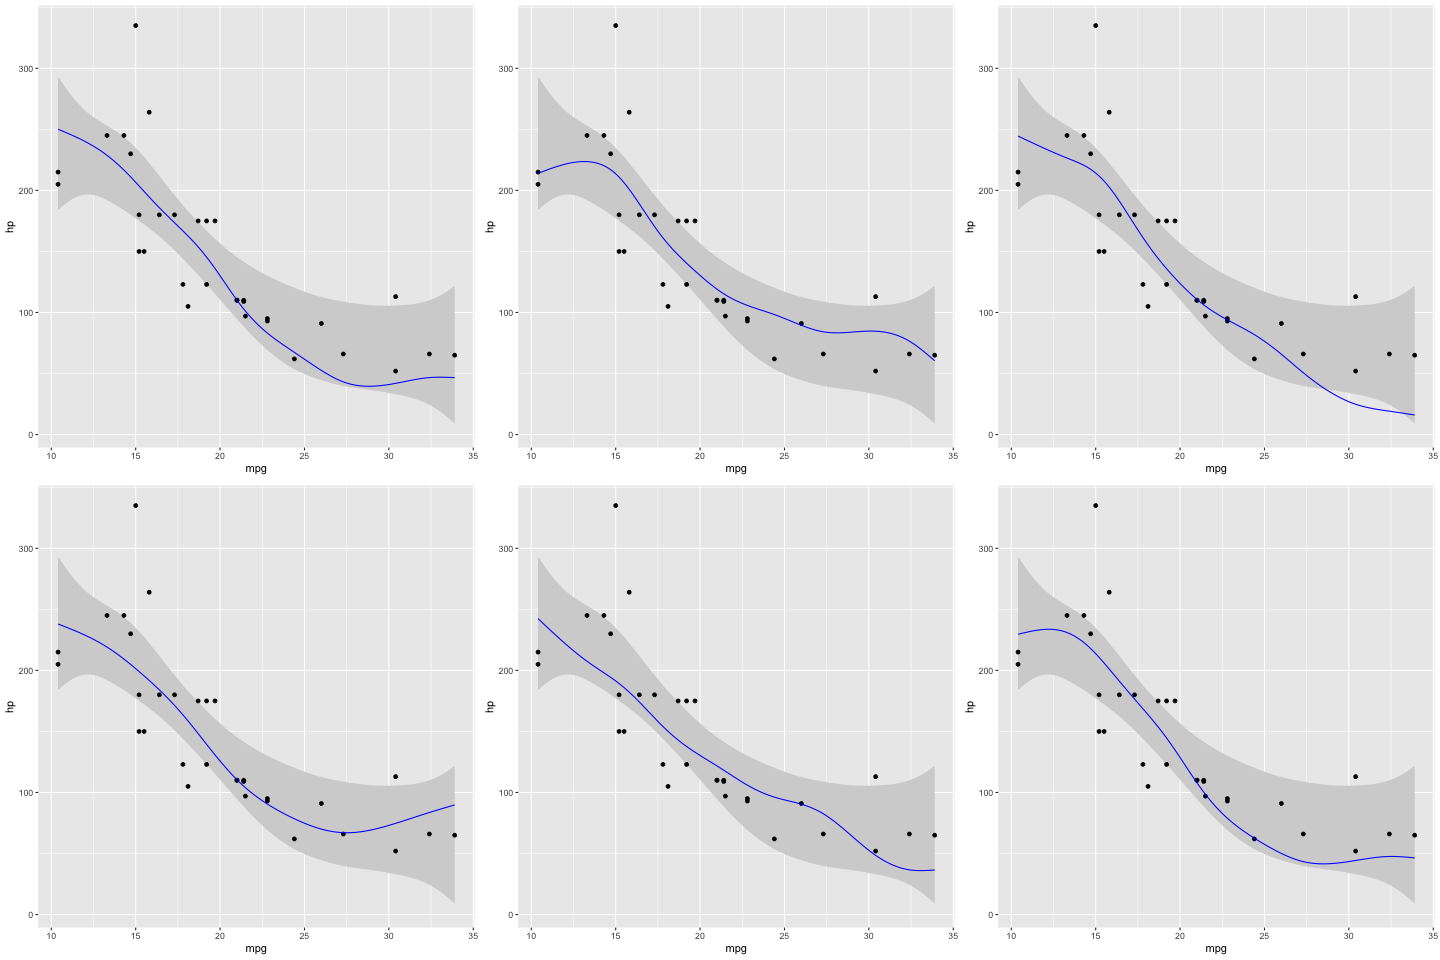
Animating smoothing uncertainty in a GAM
This file contains bidirectional Unicode text that may be interpreted or compiled differently than what appears below. To review, open the file in an editor that reveals hidden Unicode characters.
Learn more about bidirectional Unicode characters
| library(tidyverse) | |
| library(gganimate) | |
| library(mgcv) | |
| library(mvtnorm) | |
| # Fit a GAM to the data | |
| mod <- gam(hp ~ s(mpg), data=mtcars, method="REML") | |
| # Get the linear prediction matrix | |
| newdat = data.frame( | |
| mpg = seq(min(mtcars$mpg), max(mtcars$mpg), | |
| length.out = 100)) | |
| pred_mat <- predict(mod, | |
| newdata = newdat, | |
| type = "lpmatrix", | |
| unconditional = TRUE) | |
| # Get the variance-covariance matrix of coefficients, accounting for smoothing | |
| # uncertainty | |
| vcov_mat <- vcov(mod, unconditional = TRUE) | |
| # Draw 20 samples from the posterior and make predictions from them | |
| coefs <- rmvnorm(20, mean = coef(mod), sigma = vcov_mat) | |
| preds <- pred_mat %*% t(coefs) | |
| pred_df <- as_tibble(preds) %>% | |
| set_names(as.character(1:20)) %>% | |
| bind_cols(newdat) %>% | |
| gather("sample", "hp", -mpg) | |
| # Get the smoothing-uncertainty corrected confidence intervals | |
| ci_df <- predict(mod, newdata=newdat, se.fit = TRUE, unconditional = TRUE) %>% | |
| as_tibble() %>% | |
| bind_cols(newdat) %>% | |
| rename(hp = fit) %>% | |
| mutate(lo = hp - 2*se.fit, | |
| hi = hp + 2*se.fit) | |
| # Plot with animation! | |
| ggplot(pred_df, aes(x = mpg)) + | |
| geom_ribbon(mapping=aes(ymin = lo, ymax = hi), data = ci_df, fill="lightgrey", col=NA) + | |
| geom_point(mapping = aes(y=hp), data = mtcars) + | |
| geom_line(mapping = aes(y=hp), data = pred_df, col="blue") + | |
| transition_states(sample, 1, 1) | |
Author
noamross
commented
Sep 2, 2018

Sign up for free
to join this conversation on GitHub.
Already have an account?
Sign in to comment