This article is about understanding how ‘Custom Map Data’ works.
This understanding helped me create the requested feature (Geo-referenced image viewer) as part of GSoC 2022.
To learn more about
- the requested feature, visit https://wiki.openstreetmap.org/wiki/Google_Summer_of_Code/2022/Project_ideas > iD editor > Geo-referenced image viewer.
What is ‘Custom Map Data’?
‘Custom Map Data’ in the iD editor displays individual map data on OpenStreetMap (OSM).
Some terminologies
- OpenStreetMap (OSM) is a collaborative project to create a free editable geographic database of the world.
- The ‘iD’ editor is a friendly but powerful tool for contributing to OSM.
Note:
- '* new file': a file added by me
- ‘Custom Map Data’: one of the layers/UI under ‘Data Layers’ (
modules/sections/data_layers.js) - ‘Data Layers’: One of the sections under the ‘Map Data’ pane (
modules/ui/panes/map_data.js)
├── modules
├── ...
├── svg
│ ├── ...
│ ├── data.js (contains individual 'drawData' fn for layer id 'data')
│ ├── ...
│ ├── layers.js (defines where to look for 'drawData' or respective such fn of each layer)
│ ├── ...
│ ├── local_photos.js (* new file - holds individual 'drawPhotos' fn for layer id 'local-photos')
│ ├── ...
├── ui
│ ├── ...
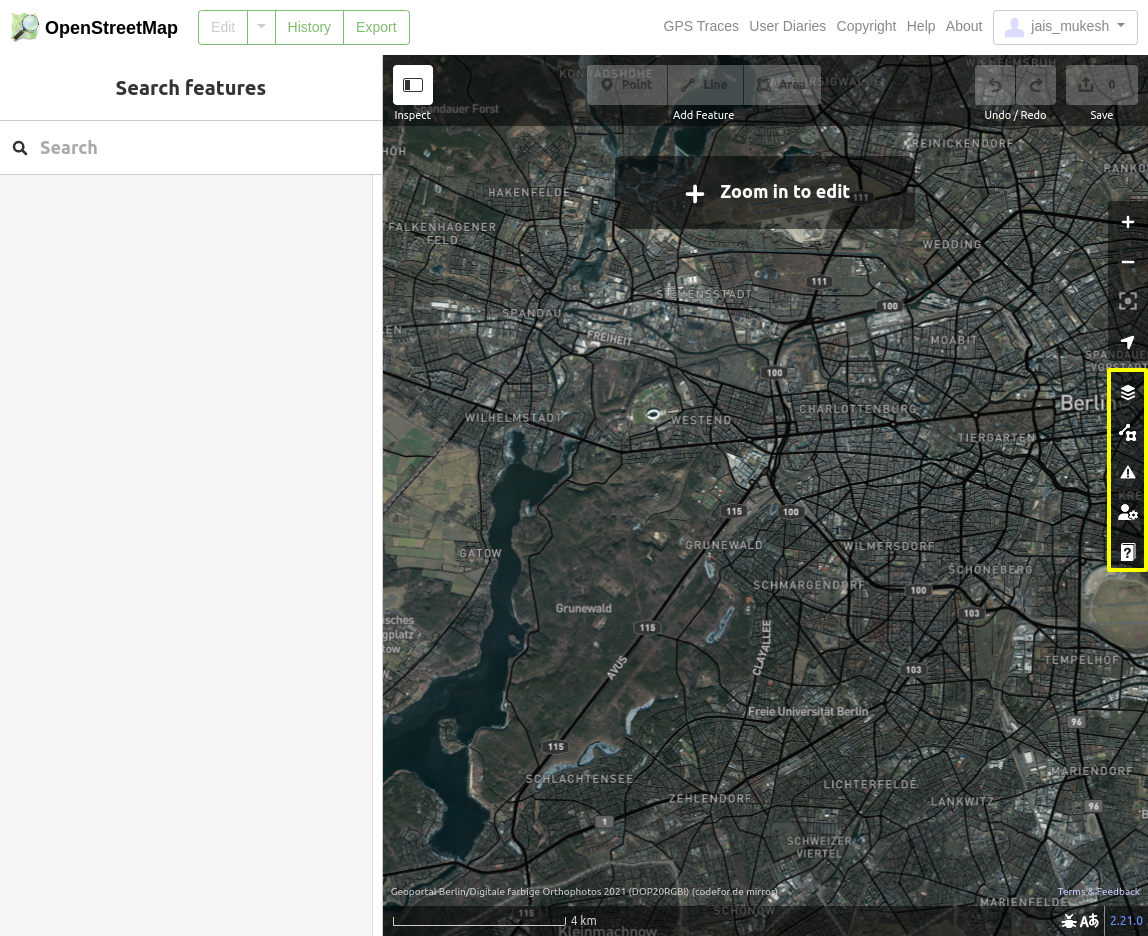
│ ├── init.js (small pane icons on the right of OSM by default)
│ ├── ...
│ ├── panes
│ │ ├── ...
│ │ ├── map_data.js (whole Map Data UI - single pane)
│ │ ├── ...
│ ├── ...
│ ├── sections
│ │ ├── ...
│ │ ├── data_layers.js (contains 'Custom Map Data' layer & 'local_photos' layer UI - individual bit)
│ │ ├── ...
│ ├── settings
│ │ ├── ...
│ │ ├── custom_data.js (modal for custom map data)
│ │ ├── ...
│ │ ├── local_photos_data.js (* new file - modal for local_photos)
│ ├── ...
modules/ui/init.js
import { uiPaneBackground } from './panes/background';
import { uiPaneHelp } from './panes/help';
import { uiPaneIssues } from './panes/issues';
import { uiPaneMapData } from './panes/map_data';
import { uiPanePreferences } from './panes/preferences';

// Line: 220 - shows small pane icons on the right by default
var uiPanes = [
            uiPaneBackground(context),
            uiPaneMapData(context),
            uiPaneIssues(context),
            uiPanePreferences(context),
            uiPaneHelp(context)
];- Reference pic
modules/ui/panes/map_data.js
import { t } from '../../core/localizer';
import { uiPane } from '../pane';

import { uiSectionDataLayers } from '../sections/data_layers';

export function uiPaneMapData(context) {

    var mapDataPane = uiPane('map-data', context)
        .key(t('map_data.key'))
        .label(t.html('map_data.title'))
        .description(t.html('map_data.description'))
        .iconName('iD-icon-data')
        .sections([
            uiSectionDataLayers(context),
            uiSectionPhotoOverlays(context),
            uiSectionMapStyleOptions(context),
            uiSectionMapFeatures(context)
        ]);

    return mapDataPane;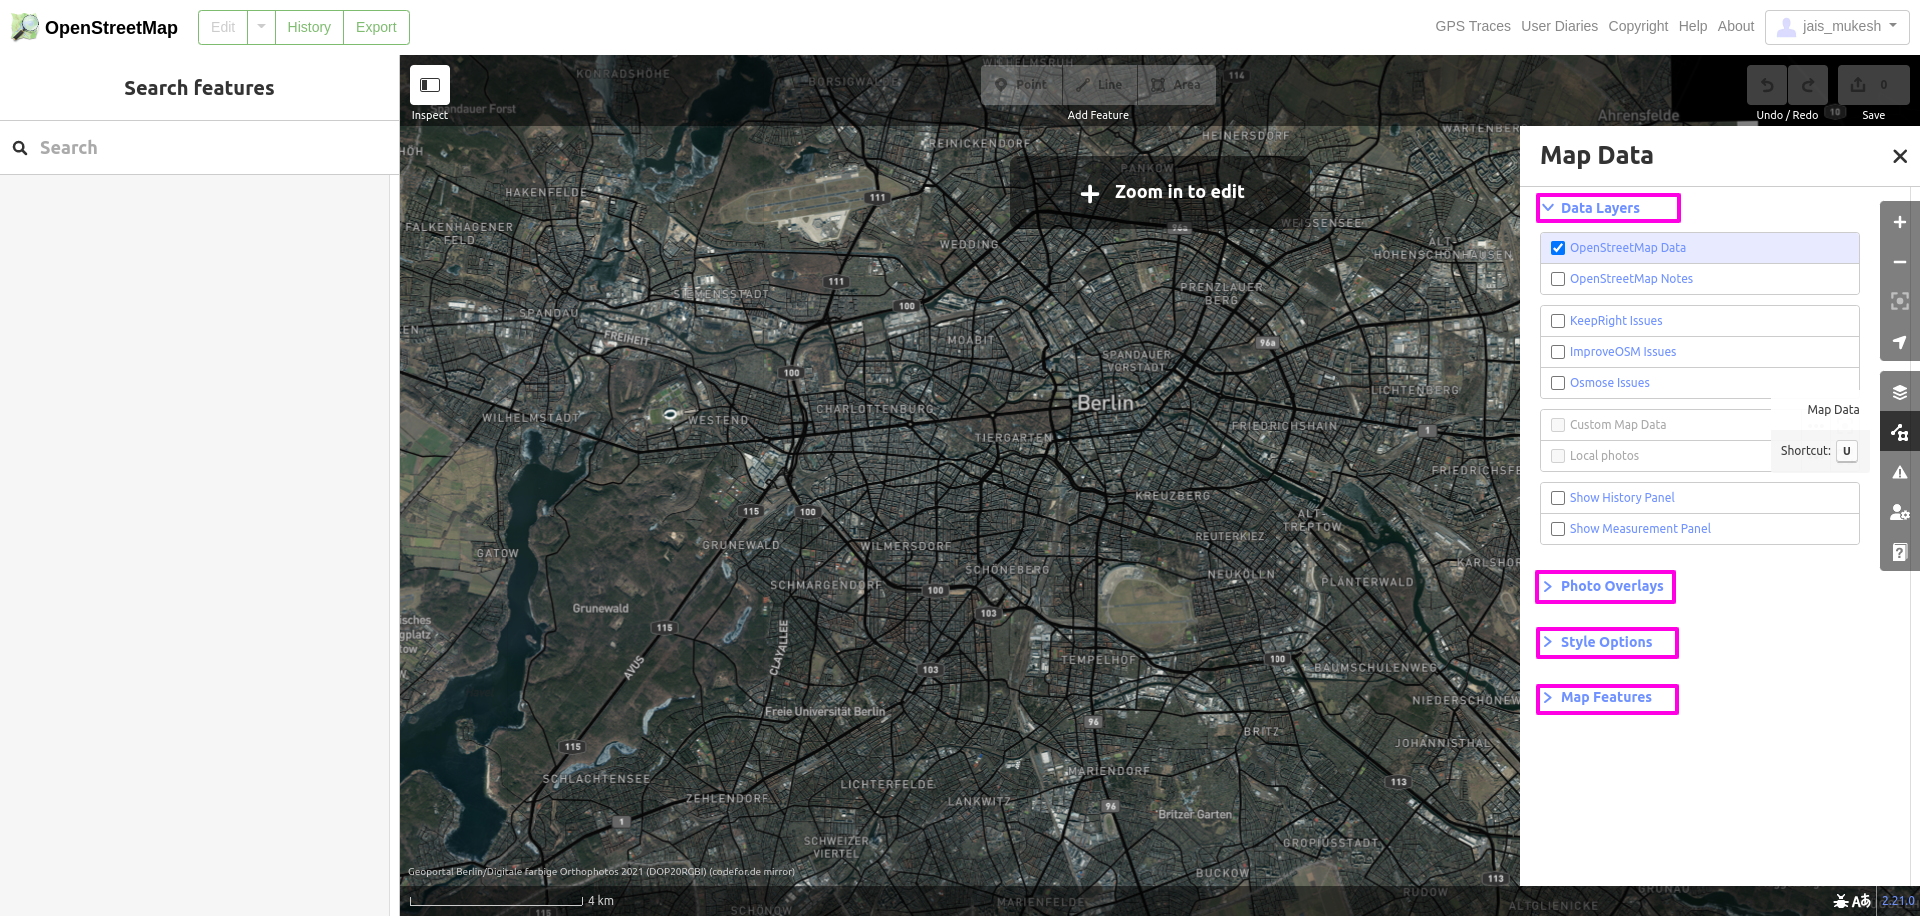
}-
Reference pic
modules/ui/sections/data_layers.js
import { uiSettingsLocalPhotosData } from '../settings/local_photos_data';

	// Step 2
	var settingsLocalPhotosData = uiSettingsLocalPhotosData(context)
        .on('change',  localPhotosChanged);

	// function drawLayers(selection)
	var layers = context.layers();

// Line 37: fn call
container.enter()
            .append('div')
            .attr('class', 'data-layer-container')
            .merge(container)
            .call(drawOsmItems)
            .call(drawQAItems)
            .call(drawCustomDataItems)
            .call(drawVectorItems)      // Beta - Detroit mapping challenge
            .call(drawPanelItems);
    }

...

function drawLocalPhotos(selection) {
  ...

	localPhotosEnter
       ....
       .on('click', function(d3_event) {
             d3_event.preventDefault();
             editLocalPhotos();
        })
				...
}

// Step 1
function editLocalPhotos() {
        context.container()
            .call(settingsLocalPhotosData);
}

// Step 3: sets the data inside `dataLayer.fileList`
function localPhotosChanged(d) {
        var dataLayer = layers.layer('local-photos');

        if (d && d.fileList) {
            dataLayer.fileList(d.fileList);
        }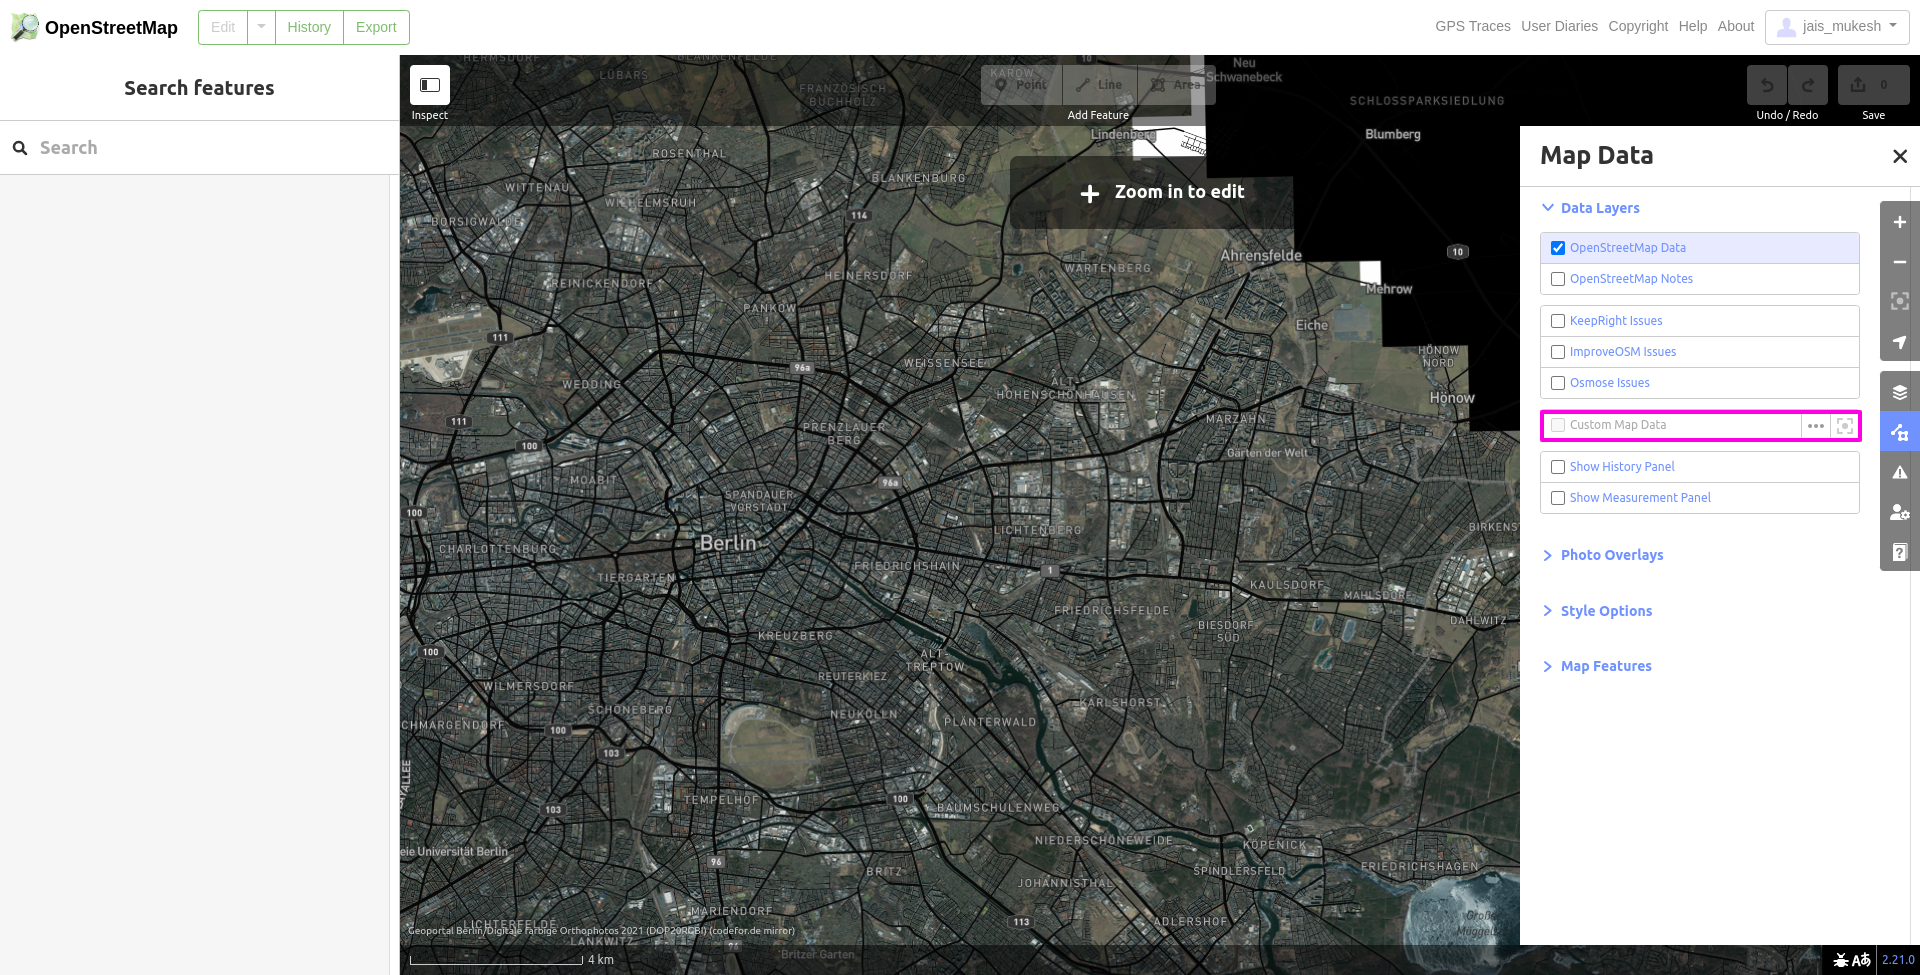
}-
Reference pic
modules/svg/layers.js
- Imports the function
- Defines a layer in
_layers - Calls
drawDataof each layer
...
import { svgData } from './data';
// new
import { svgLocalPhotos} from './local_photos';
...

export function svgLayers(projection, context) {

	var _layers = [
		...
		{ id: 'data', layer: svgData(projection, context, dispatch) },
		// new
		{ id: 'local-photos', layer: svgLocalPhotos(projection, context, dispatch) },
		...
	];

	// Step 4
	function drawLayers(selection) {
		...

				// Step 4
				// calls 'drawData' method defined in each layer
				// For custom data, method name 'drawData' is defined on L167 -> modules/svg/data.js
				// For local photos, method name 'drawPhotos' is defined in -> modules/svg/local_photos.js
				.each(function(d) { d3_select(this).call(d.layer); });
	}

	// Step 3
	// 'change' event is bound to the function 'drawLayers'
	// For Step 2: see - modules/svg/data.js
	return utilRebind(drawLayers, dispatch, 'on');
}
modules/svg/data.js
- Loads the set data
- Dispatches ‘change’ event
- Actually, draws the data
// Step 5
// actually draw the data
// Line 167
function drawData(selection) {
	...
}

// Step 1
// Loads the set data in Step 3 of modules/ui/sections/data_layers.js
// Line 333
drawData.setFile = function(extension, data) {
	_template = null;
  _fileList = null;
  _geojson = null;
  _src = null;

	...

	// Step 2
	// dispatch the event 'change'
	// See modules/svg/layers.js > Line 122
	// For Step 3 - see end of modules/svg/data.js
	dispatch.call('change');
  return this;
}I had to create modules/svg/local_photos.js similar to modules/svg/data.js
Since it was about images, I also took inspiration from modules/svg/mapillary_images.js
This new file is where the uploaded local files(images) had to be
- parsed for exif metadata, gathering latitude and longitude of each image and
- markers had to be displayed on the map, clicking on which would show the corresponding image