-
-
Save pasrom/9627958cd3d936c302f30a692373bb9c to your computer and use it in GitHub Desktop.
| // Lizenz: AGES Dashboard COVID19 AT | |
| // Use 3-digit GKZ (third row of https://covid19-dashboard.ages.at/data/CovidFaelle_Timeline_GKZ.csv). | |
| // Widget Parameter: "204,KFL;312;706" for Klagenfurt Land (shown as KFL), Korneuburg and Landeck | |
| // | |
| // Based on the german variant: | |
| // - kevinkub https://gist.github.com/kevinkub/46caebfebc7e26be63403a7f0587f664 | |
| // - Baumchen https://gist.github.com/Baumchen/6d91df0a4c76c45b15576db0632e4329 | |
| // | |
| // No guarantee on correctness and completeness of the information provided. | |
| const urlTimelineGkz = "https://covid19-dashboard.ages.at/data/CovidFaelle_Timeline_GKZ.csv" | |
| const urlTimeline = "https://covid19-dashboard.ages.at/data/CovidFaelle_Timeline.csv" | |
| const urlRValues = "https://script.google.com/macros/s/AKfycby_a0nPXgDfca_SrnX1w6W8qpmjlSdmG9kMW25QnY-D8a4rfUU/exec" | |
| const reverseGeocodingUrl = (location) => `https://nominatim.openstreetmap.org/search.php?q=${location.latitude.toFixed(3)}%2C%20${location.longitude.toFixed(3)}&polygon_geojson=1&format=jsonv2` | |
| const jsonBKZData = "https://api.npoint.io/6b3942356a3ddcb584b3" | |
| class LineChart { | |
| // LineChart by https://kevinkub.de/ | |
| constructor(width, height, seriesA, seriesB) { | |
| this.ctx = new DrawContext(); | |
| this.ctx.size = new Size(width, height); | |
| this.seriesA = seriesA; | |
| this.seriesB = seriesB; | |
| } | |
| _calculatePath(series, fillPath) { | |
| let maxValue = Math.max(...series); | |
| let minValue = Math.min(...series); | |
| let difference = maxValue - minValue; | |
| let count = series.length; | |
| let step = this.ctx.size.width / (count - 1); | |
| let points = series.map((current, index, all) => { | |
| let x = step * index; | |
| let y = this.ctx.size.height - (current - minValue) / difference * this.ctx.size.height; | |
| return new Point(x, y); | |
| }); | |
| return this._getSmoothPath(points, fillPath); | |
| } | |
| _getSmoothPath(points, fillPath) { | |
| let path = new Path(); | |
| path.move(new Point(0, this.ctx.size.height)); | |
| path.addLine(points[0]); | |
| for (let i = 0; i < points.length - 1; i++) { | |
| let xAvg = (points[i].x + points[i + 1].x) / 2; | |
| let yAvg = (points[i].y + points[i + 1].y) / 2; | |
| let avg = new Point(xAvg, yAvg); | |
| let cp1 = new Point((xAvg + points[i].x) / 2, points[i].y); | |
| let next = new Point(points[i + 1].x, points[i + 1].y); | |
| let cp2 = new Point((xAvg + points[i + 1].x) / 2, points[i + 1].y); | |
| path.addQuadCurve(avg, cp1); | |
| path.addQuadCurve(next, cp2); | |
| } | |
| if (fillPath) { | |
| path.addLine(new Point(this.ctx.size.width, this.ctx.size.height)); | |
| path.closeSubpath(); | |
| } | |
| return path; | |
| } | |
| configure(fn) { | |
| let pathA = this._calculatePath(this.seriesA, true); | |
| let pathB = this._calculatePath(this.seriesB, false); | |
| if (fn) { | |
| fn(this.ctx, pathA, pathB); | |
| } else { | |
| this.ctx.addPath(pathA); | |
| this.ctx.fillPath(pathA); | |
| this.ctx.addPath(pathB); | |
| this.ctx.fillPath(pathB); | |
| } | |
| return this.ctx; | |
| } | |
| } | |
| const calcMode = { | |
| none: 0, | |
| incidence: 1, | |
| cases: 2, | |
| }; | |
| function parseLocation(location) { | |
| const components = location.split(",") | |
| return { | |
| gkz: components[0], | |
| name: components.length >= 2 ? components[1] : null, | |
| } | |
| } | |
| function calc(data, location, nr = 0) { | |
| ctr = 0 | |
| for (line of data) { | |
| const components = line.split(";") | |
| if (components[2] === location["gkz"]) { | |
| if (nr === ctr) { | |
| let fmt = new DateFormatter() | |
| fmt.dateFormat = 'dd.MM.yyyy HH:mm:ss' | |
| return { | |
| incidence: Math.round(parseFloat(components[6]) * (100000 / parseFloat(components[3]))), | |
| cases: parseFloat(components[4]), | |
| cured: parseFloat(components[10]), | |
| name: location["name"] ? location["name"] : components[1], | |
| date: fmt.date(components[0]), | |
| } | |
| } | |
| ctr++ | |
| } | |
| } | |
| return { | |
| error: "GKZ unbekannt.", | |
| } | |
| } | |
| function calc2(data, location, row, nr = 0) { | |
| ctr = 0 | |
| for (line of data) { | |
| const components = line.split(";") | |
| if (components[2] === location["gkz"]) { | |
| if (nr === ctr) { | |
| let fmt = new DateFormatter() | |
| fmt.dateFormat = 'dd.MM.yyyy HH:mm:ss' | |
| return { | |
| value: parseFloat(components[row]), | |
| date: fmt.date(components[0]), | |
| } | |
| } | |
| ctr++ | |
| } | |
| } | |
| return { | |
| error: "GKZ unknown.", | |
| } | |
| } | |
| function getTimeline(data, location, nr) { | |
| var timeline = [] | |
| for (line of data) { | |
| const components = line.split(";") | |
| if (components[2] === location["gkz"]) { | |
| timeline.push(parseFloat(components[nr])) | |
| } | |
| } | |
| return timeline | |
| } | |
| let widget = await createWidget() | |
| if (!config.runsInWidget) { | |
| await widget.presentSmall() | |
| } | |
| Script.setWidget(widget) | |
| Script.complete() | |
| function getRegexedData(text, regex, nr) { | |
| var matched = [] | |
| var matches = text.matchAll(regex) | |
| for (match of matches) { | |
| matched.push(match[nr]) | |
| } | |
| return matched | |
| } | |
| function getRValues(data) { | |
| const regex = /e(\d,?\d*)/gm; | |
| const regex_data = /(Reproduktionszahl|Neuinfektionen){1} ((heute|gestern)? ?(\d\d\.\d\d\.\d\d\d\d)?(\d\d:\d\d)?)/gm; | |
| const regex_date = /(\d\d.\d\d.\d\d\d\d)/gm; | |
| matched_data = getRegexedData(data, regex, 1) | |
| matched_date = getRegexedData(data, regex_data, 0) | |
| let fmt = new DateFormatter() | |
| fmt.dateFormat = 'dd.MM.yyyy' | |
| r_values = [] | |
| for (var i = 0; i <= matched_data.length - 1; i++) { | |
| if (matched_date[i].match(regex_date) == null) { | |
| date = new Date() | |
| } else { | |
| date = fmt.date(matched_date[i].match(regex_date)[0]) | |
| } | |
| if (matched_date[i].includes("Reproduktionszahl")) { | |
| name = "R" | |
| } else if (matched_date[i].includes("Neuinfektionen")) { | |
| name = "Cases" | |
| } | |
| tmp = { | |
| name: name, | |
| value: parseFloat(matched_data[i].replace(",", ".")), | |
| date: date, | |
| } | |
| r_values.push(tmp) | |
| } | |
| return r_values | |
| } | |
| async function getLocation() { | |
| try { | |
| Location.setAccuracyToThreeKilometers() | |
| return await Location.current() | |
| } catch (e) { | |
| return null; | |
| } | |
| } | |
| async function getBkzNumber(url, location) { | |
| const act_location = await getLocation(); | |
| let discrict_from_gps = await new Request(reverseGeocodingUrl(act_location)).loadJSON() | |
| let BKZData = await new Request(url).loadJSON() | |
| tmp = discrict_from_gps[0].display_name | |
| reg = /Bezirk (.*?),/ | |
| disctrict = reg.exec(tmp)[1] | |
| act_bkz = 0 | |
| for (var i = 0; i < BKZData.length; i++) { | |
| if (BKZData[i].Bezirk === disctrict) { | |
| act_bkz = BKZData[i].BKZ + "," + BKZData[i].KFZ | |
| break | |
| } | |
| } | |
| return act_bkz | |
| } | |
| async function createWidget(items) { | |
| const list = new ListWidget() | |
| list.setPadding(10, 10, 0, 0) | |
| if (args.widgetParameter) { | |
| parameter = args.widgetParameter | |
| } else { | |
| parameter = "802,B;803,DO;804,FK" | |
| } | |
| try { | |
| BKZNr = await getBkzNumber(jsonBKZData) + ";" | |
| } catch (e) { | |
| BKZNr = "" | |
| log(e) | |
| } | |
| parameter = BKZNr + parameter | |
| const locations = parameter.split(";").map(parseLocation) | |
| const states = "10,🇦🇹".split(";").map(parseLocation) | |
| const req_timeline_gkz = await new Request(urlTimelineGkz).loadString() | |
| const timeline_gkz_lines = req_timeline_gkz.split("\n").reverse() | |
| const req_timeline = await new Request(urlTimeline).loadString() | |
| const timeline_lines = req_timeline.split("\n").reverse() | |
| const req_r_values = await new Request(urlRValues).loadString() | |
| r_values = getRValues(req_r_values) | |
| data_timeline = [] | |
| for (var i = 0; i < 4; i++) { | |
| data_timeline.push(calc(timeline_lines, states[0], i)) | |
| } | |
| let day_month_formatter = new DateFormatter() | |
| day_month_formatter.dateFormat = "dd/MM" | |
| const infected_stack = list.addStack() | |
| infected_stack.layoutHorizontally() | |
| for (var i = 0; i < 3; i++) { | |
| const text_cases = data_timeline[i]["cases"] + " " + getTrendArrow(data_timeline[i + 1]["cases"], data_timeline[i]["cases"]) | |
| const date_cases = `${data_timeline[i]["date"].getDate()}.${data_timeline[i]["date"].getMonth() + 1}.${data_timeline[i]["date"].getFullYear()}` | |
| var text_r = "N/A" | |
| for (var j = 0; j < r_values.length; j++) { | |
| date_r = `${r_values[j]["date"].getDate()}.${r_values[j]["date"].getMonth() + 1}.${r_values[j]["date"].getFullYear()}` | |
| if (date_cases === date_r && r_values[j]["name"] === "R") { | |
| text_r = r_values[j]["value"] | |
| break | |
| } | |
| } | |
| const date_infected = infected_stack.addText( | |
| day_month_formatter.string(data_timeline[i]["date"]) + "\n" + | |
| text_cases + "\n" + | |
| text_r | |
| ) | |
| date_infected.font = Font.mediumSystemFont(10) | |
| date_infected.centerAlignText() | |
| infected_stack.addSpacer() | |
| } | |
| list.addSpacer(5) | |
| const incidence_stack = list.addStack() | |
| incidence_stack.layoutVertically() | |
| incidence_stack.useDefaultPadding() | |
| const header = incidence_stack.addText("🦠 7-day-incidence") | |
| header.font = Font.mediumSystemFont(11) | |
| incidence_stack.addSpacer(2) | |
| const line = incidence_stack.addStack() | |
| line.layoutHorizontally() | |
| line.useDefaultPadding() | |
| // show incidence for austria | |
| printIncidence(line, data_timeline[0], data_timeline[1]) | |
| // show incidence for given districts | |
| ctr = 0 | |
| for (location of locations) { | |
| // do not print if it's the same as the actual location | |
| if (locations[0]["gkz"] === location["gkz"] && ctr != 0) { | |
| continue | |
| } | |
| const data = calc(timeline_gkz_lines, location) | |
| const data_yesterday_2 = calc(timeline_gkz_lines, location, 1) | |
| if (data["error"]) { | |
| list.addText(data["error"]) | |
| continue | |
| } | |
| printIncidence(line, data, data_yesterday_2) | |
| ctr++ | |
| } | |
| list.addSpacer(5) | |
| data_infected = [] | |
| for (var i = 0; i < 2; i++) { | |
| let data_cases_sum_today = calc2(timeline_lines, states[0], 5, i) | |
| let data_cases_cured_sum_today = calc2(timeline_lines, states[0], 11, i) | |
| tmp = { | |
| value: data_cases_sum_today["value"] - data_cases_cured_sum_today["value"], | |
| date: data_cases_sum_today["date"], | |
| } | |
| data_infected.push(tmp) | |
| } | |
| printActiveCases(list, data_infected[0], data_infected[1]) | |
| list.addSpacer() | |
| let data = getTimeline(timeline_lines, states[0], 4).reverse() | |
| let sum_cases = getTimeline(timeline_lines, states[0], 6).reverse() | |
| let sum_cured = getTimeline(timeline_lines, states[0], 12).reverse() | |
| let infected = sum_cases.filter(x => !sum_cured.includes(x)); | |
| let chart = new LineChart(800, 800, data, infected).configure((ctx, pathA, pathB) => { | |
| ctx.opaque = false; | |
| ctx.setFillColor(new Color("888888", .5)); | |
| ctx.addPath(pathA); | |
| ctx.fillPath(pathA); | |
| ctx.addPath(pathB); | |
| ctx.setStrokeColor(Color.white()); | |
| ctx.setLineWidth(1) | |
| ctx.strokePath(); | |
| }).getImage(); | |
| list.backgroundImage = chart | |
| return list | |
| } | |
| function printActiveCases(stack, data, data_yesterday) { | |
| const line = stack.addStack() | |
| line.setPadding(0, 0, 0, 0) | |
| line.layoutVertically() | |
| const name = line.addText("🦠 active cases 🇦🇹") | |
| name.font = Font.mediumSystemFont(11) | |
| const label = line.addText(data["value"] + getTrendArrow(data_yesterday["value"], data["value"])) | |
| label.font = Font.boldSystemFont(11) | |
| label.textColor = Color.orange() | |
| label.centerAlignText() | |
| } | |
| function printIncidence(stack, data, data_yesterday) { | |
| value = data["incidence"] | |
| description = data["name"] | |
| const line = stack.addStack() | |
| line.setPadding(0, 0, 0, 0) | |
| line.layoutVertically() | |
| const label = line.addText(String(value) + getTrendArrow(data_yesterday["incidence"], data["incidence"])) | |
| label.font = Font.boldSystemFont(11) | |
| label.centerAlignText() | |
| if (value >= 50) { | |
| label.textColor = Color.red() | |
| } else if (value >= 35) { | |
| label.textColor = Color.orange() | |
| } else { | |
| label.textColor = Color.green() | |
| } | |
| stack.addSpacer(1) | |
| const name = line.addText(description) | |
| name.minimumScaleFactor = 0.3 | |
| name.font = Font.systemFont(10) | |
| name.lineLimit = 1 | |
| stack.addSpacer(2) | |
| } | |
| function getTrendArrow(preValue, currentValue) { | |
| return (currentValue <= preValue) ? '↓' : '↑' | |
| } |
Update with timelines. Kudos to @kevinkub

Danke. Sieht gut aus. Ich bekomme leider immer den Fehler:
Error on line 14:103: TypeError: null is not an object (evaluating 'location.latitude')
@ottoplo das Widget benötigt jetzt die Berechtigung den Standort zu verwenden, da die zweite Inzidenz-Anzeige (gelb markiert) auf den Bezirk geht, in dem sich das Gerät befindet.

Hallo @pasrom,
schade, dadurch funktioniert das Script in Deutschland nicht mehr.
Viele Grüße,
Thomas
Hallo @abbanatic,
an diesen Use-Case hatte ich nicht gedacht.
Habe ein fix gepusht.
Beste Grüße
Roman
Hallo @pasrom
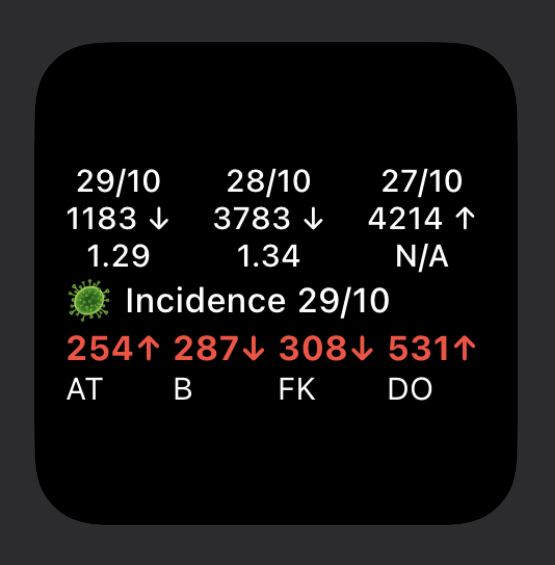
kannst du vielleicht etwas genauer beschreiben was die Werte und Abkürzungen bedeuten?
Finde das Widget echt gelungen, jedoch fehlt mir noch ein wenig die Übersicht.

Danke!
Viele Grüße,
Michael
Hallo,
ich habe mir nun das meiste schon selbst gesucht.
Vielleicht hilft es jemanden anderen...

@pasrom wäre es vielleicht möglich die aktuelle Anzahl der aktiven Fälle anzuzeigen?
(AnzahlFaelleSum - AnzahlGeheiltSum → Anzahl aktive Fälle)

Hallo @abbanatic,
an diesen Use-Case hatte ich nicht gedacht.
Habe ein fix gepusht.Beste Grüße
Roman
Vielen Dank, es funktioniert perfekt.
@IT-Lueg Danke für deine Beschreibung, eine kleine Ergänzung: der erste Bezirk der Inzidenz-Fälle (398 B) in deiner Beschreibung, sollte den aktuellen Bezirk anzeigen, in dem sich das Gerät befindet. Falls keine Ortungsdienste aktiviert sind, oder sich das Gerät außerhalb von Österreich befindet, werden die default Werte oder die eingestellten Parameter verwendet (eingestellte Parameter sticht default Werte).
Ja, das ist möglich. Ich werde mir das am Abend ansehen.
@IT-Lueg passt Dir das so:

sieht super aus, danke :)
Servus ,
Ich hab das Widget gestern 05.11 installiert und heute 06.11 zeigt es immer noch alte Daten ( es fehlt oben der 04.11)

Hallo @kwieser76,
darf ich dich auf diesen Twitter Thread verweisen: https://twitter.com/pasr0m/status/1324587414321508352?s=20
Hallo @pasrom!
Vorweg danke dass du eine Fork für Österreich erstellt hast.
Wäre es evtl. möglich unterhalb von den aktiven Fällen Österreich die aktuellen/active Coronafälle an dem aktuell befindlichen Standort anzeigen zu lassen (inkl. Ortsangabe evtl.)?
Danke nochmals! Top Arbeit!!
Ich habe dieses gist jetzt auf github verschoben: https://github.com/pasrom/corona-widget-at
und werde dort weiterentwickeln, da es die Arbeit bezüglich Feature Wünsche, Bugs usw. erleichtert.
Hallo und vielen Dank für dieses gelungene Script. Vielleicht kann man die Inzidenzzahlen noch etwas Größer darstellen? Gibt es dies Darstellungen auch für Deutschland? Wäre Super. Danke
@hxperman ja, das kann ich versuchen.
Nein, genau diese Darstellung gibt es nicht für Deutschland.
Preview: