Ok, this is a quick document to guide you through the setup of a Godot project in Visual Studio Code.
I'll assume you have a working C# environment installed. Note that on Linux, you might need to install Mono for everything to work fine with Godot 3.x.
First off, make sure you have the following extensions installed and active in Visual Studio Code:
- C#
- C# Tools for Godot (This is only for Godot 3.x)
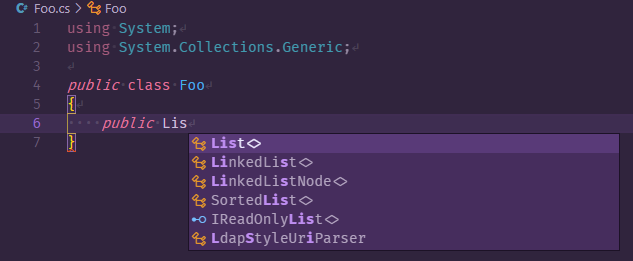
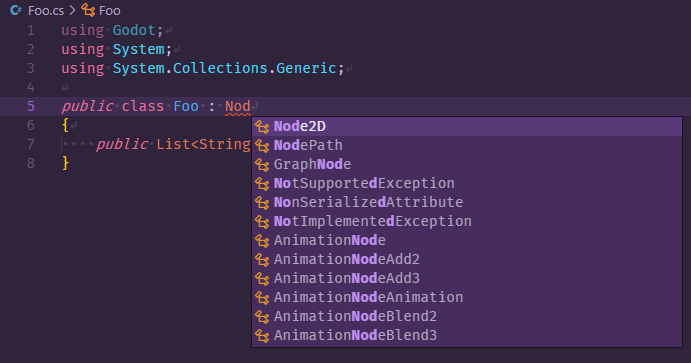
At this point (after you restart the editor) you should already be able to use code completion for C#, except for anything coming from the Godot namespaces.
The next step is to actually create a project in Godot.
In Godot's menus: go into Project > Tools > C#, and click on Create C# solution.

After a few seconds and some loading bars, you should see a new menu appear in the bottom dock. It opens the panel where you'll see build reports for the C# project.

If you don't see this button, check your project for a .csproj and a .sln file. They should already be here and you can skip this step.
In the new panel, click on Build > Build Project. Everything should go smoothly. After all, the project is empty. Once the build is done, let's proceed to the next step.

Back in Visual Studio Code, open up the command palette (Ctrl+Shift+P), search for the OmniSharp: Restart omniSharp command and run it.

It may ask you to choose a project, select the .sln option.
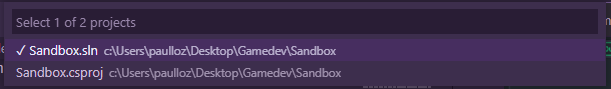
/!\ It is very important that you do not click out this box without selecting anything. If you do so: do not panic and search for the OmniSharp: Select Project command in the palette.

Once you've selected your project and OmniSharp is properly started, the name of the project should appear in the lower left corner of Visual Studio Code. The small flame on its left is the icon for OmniSharp, it lights up when the service is busy.

Once all of this is done, everything should work fine.
Head out to the Run and Debug menu in Visual Studio Code and you'll see a small link titled create a launch.json file.

Click on it and a menu appears, asking you to select an environment. Choose C# Godot.

Once it's done, the Run and Debug menu will change and you'll be able to start debugging with the Play in Editor button.

Create .vscode/launch.json and .vscode/tasks.json files, like for any other C# project. If you need, you can find examples here and here.
❤️
Thank You, this was very helpful. It worked for me in Version 4.0 too.