Created
June 5, 2018 01:17
-
-
Save quantum-kite/9a935269845eae3f8590f364be12cb49 to your computer and use it in GitHub Desktop.
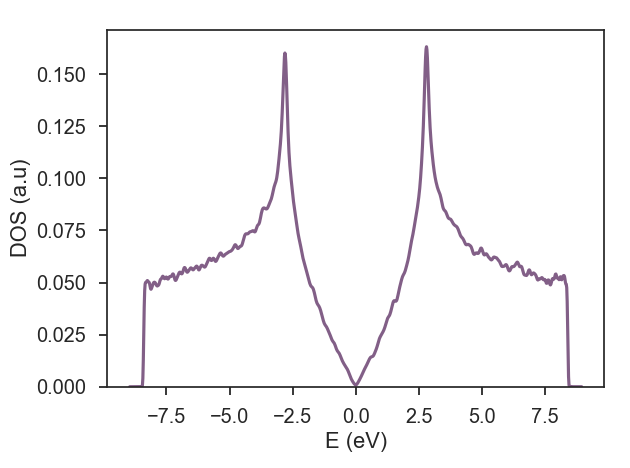
script for DOS plotting
This file contains bidirectional Unicode text that may be interpreted or compiled differently than what appears below. To review, open the file in an editor that reveals hidden Unicode characters.
Learn more about bidirectional Unicode characters
| import matplotlib.pyplot as plt | |
| import h5py | |
| import matplotlib as mpl | |
| import numpy as np | |
| #************************************ | |
| #keep these definitions for kite website | |
| import seaborn as sns | |
| mpl.rcParams['figure.dpi'] = 100 | |
| mpl.rcParams['savefig.dpi'] = 100 | |
| sns.set_style("white") | |
| #Kite color scheme | |
| colors = ["dusty purple", "faded green","windows blue", "amber", "greyish"] | |
| current_palette=sns.xkcd_palette(colors) | |
| sns.set_palette(current_palette) | |
| sns.set_style("ticks") | |
| sns.set_context("talk",font_scale=1.1) | |
| #************************************* | |
| data=np.loadtxt('dos.dat') | |
| plt.plot(data[:,0],data[:,1]) | |
| plt.xlabel('E (eV)') | |
| plt.ylabel('DOS (a.u)') | |
| plt.ylim(ymin=0) | |
| #plt.xlim(-3.5,3.5) | |
| plt.legend() | |
| plt.tight_layout() | |
| plt.show() |
Author
quantum-kite
commented
Jun 5, 2018
Sign up for free
to join this conversation on GitHub.
Already have an account?
Sign in to comment