Last active
April 24, 2018 20:46
-
-
Save reinerBa/6e7a6a3586b5658cba50b3ede4c325bc to your computer and use it in GitHub Desktop.
A vue.js component to draw a line chart with svg
This file contains bidirectional Unicode text that may be interpreted or compiled differently than what appears below. To review, open the file in an editor that reveals hidden Unicode characters.
Learn more about bidirectional Unicode characters
| /*! Copyright (c) 2018, Reiner Bamberger (https://github.com/reinerBa). All rights reserved. | |
| * Use of this source code is governed the therms of the MIT license that can be found | |
| * at https://github.com/reinerBa/Vue-Responsive/blob/master/LICENSE | |
| */ | |
| var simpleSvgChart = { | |
| name: 'simple-svg-chart', | |
| props: { | |
| title: { type: String, default: '' }, // title of the chart | |
| values: { type: Array, default: null }, // the values that shall be displayed | |
| labels: { type: Array, default: null }, // if not the values but other digits should be displayed | |
| titleTop: {type: Boolean, default: true}, // show title on top, needs a title to be defined | |
| titleClass: {type: Array | Object, required: false}, // class to style the title | |
| pathClass: {type: Array | Object, required: false}, // class for the chart line | |
| lineColor: {type: String, default: 'rgba(255, 255, 255, 0.3)'}, // color for the chart line | |
| labelColor: {type: String, default: 'white'}, // color for the labels | |
| showPercent: {type: Boolean, default: false}, // uses y-range from 0 - 100 | |
| valuePostfix: {type: String, default: ''} // puts a postfix char to the values like '%' or '$' | |
| }, | |
| computed: { | |
| pathLength () { | |
| return (this.values.length - 1) * 100 + 25 | |
| }, | |
| yMax () { | |
| return Math.max(...this.values) | |
| }, | |
| yMin () { | |
| return Math.min(...this.values) | |
| }, | |
| path () { | |
| return this.values.map((value, i) => [i * 100, this.stretch(value)]) | |
| }, | |
| firstValue () { | |
| return this.stretch(this.values[0]) | |
| }, | |
| lastValue () { | |
| return this.stretch(this.values[this.values.length - 1]) | |
| }, | |
| max () { | |
| return !this.showPercent ? this.yMax : 100 | |
| }, | |
| min () { | |
| return !this.showPercent ? this.yMin : 0 | |
| }, | |
| scoring () { | |
| return this.showPercent ? 1 : 100 / (this.max - this.min) | |
| }, | |
| visibleLabels () { | |
| if (this.labels) return this.labels | |
| else return this.values.map(e => Math.round(e) + this.valuePostfix) | |
| } | |
| }, | |
| methods: { | |
| stretch (v) { | |
| return 100 - ((v - this.min) * this.scoring) | |
| }, | |
| labelClicked (event, value, label) { | |
| this.$emit('pointClicked', {event, value, label}) | |
| } | |
| }, | |
| template: `<div class="svg-barchart"> | |
| <figure> | |
| <figcaption v-if="titleTop && title"> | |
| <p :class="titleClass" class="chart_title">{{title}}</p> | |
| </figcaption> | |
| <svg xmlns="http://www.w3.org/2000/svg" :viewBox="'-25 -20 '+pathLength+' 125'"> | |
| <path :class="pathClass" :d="'M'+path" | |
| fill="none" :stroke="lineColor" | |
| stroke-width="1.2" stroke-linecap="round" stroke-linejoin="round"/> | |
| <path :d="'M0,0,0,100'" | |
| fill="none" stroke="white" | |
| stroke-width="1" stroke-linecap="round" stroke-linejoin="round"/> | |
| <path :d="'M0,100,'+pathLength+',100'" | |
| fill="none" stroke="white" | |
| stroke-width="1" stroke-linecap="round" stroke-linejoin="round"/> | |
| <text x="-21" y="100" font-size="11" font-weight="200" fill="yellow">{{(min|0)}}</text> | |
| <text x="-21" y="3" font-size="11" font-weight="200" fill="yellow">{{(max|0)}}</text> | |
| <text x="2" :y="firstValue - 7.5" font-size="11" font-weight="200" | |
| @click="labelClicked($event, values[0], visibleLabels[0])" :fill="labelColor">{{ visibleLabels[0] }}</text> | |
| <text :x="-22+100 * (values.length-1)" :y="lastValue - 7.5" font-size="11" | |
| font-weight="200" @click="labelClicked($event, values[values.length-1], visibleLabels[values.length-1])" | |
| :fill="labelColor">{{ visibleLabels[visibleLabels.length-1] }}</text> | |
| <text v-if="idx !== 0 && idx !== path.length-1" @click="labelClicked($event, values[idx], visibleLabels[idx])" | |
| v-for="([ x, y ], idx) in path" :x="x - 10" :y="y - 7.5" | |
| :key="idx" font-size="11" font-weight="200" :fill="labelColor"> | |
| {{ visibleLabels[idx] }} | |
| </text> | |
| </svg> | |
| <figcaption v-if="!titleTop"> | |
| <p :class="titleClass" class="chart_title">{{title}}</p> | |
| </figcaption> | |
| </figure> | |
| <style> | |
| .svg-barchart text{ | |
| cursor: default; | |
| } | |
| .svg-barchart figure { | |
| margin: 0; | |
| } | |
| .svg-barchart .chart_title { | |
| color: white; | |
| } | |
| .svg-barchart .svg-barchart { | |
| background: darkgreen; | |
| border-radius: 4px; | |
| padding: 20px; | |
| transition: all 0.2s; | |
| } | |
| </style> | |
| </div>` | |
| } |
This file contains bidirectional Unicode text that may be interpreted or compiled differently than what appears below. To review, open the file in an editor that reveals hidden Unicode characters.
Learn more about bidirectional Unicode characters
| <template> | |
| <div class="svg-barchart"> | |
| <figure> | |
| <figcaption v-if="titleTop && title"> | |
| <p :class="titleClass" class="chart_title">{{title}}</p> | |
| </figcaption> | |
| <svg xmlns="http://www.w3.org/2000/svg" :viewBox="`-25 -20 ${pathLength} 125`"> | |
| <path :class="pathClass" :d="`M${path}`" | |
| fill="none" :stroke="lineColor" | |
| stroke-width="1.2" stroke-linecap="round" stroke-linejoin="round"/> | |
| <path :d="`M0,0,0,100`" | |
| fill="none" stroke="white" | |
| stroke-width="1" stroke-linecap="round" stroke-linejoin="round"/> | |
| <path :d="`M0,100,${pathLength},100`" | |
| fill="none" stroke="white" | |
| stroke-width="1" stroke-linecap="round" stroke-linejoin="round"/> | |
| <text x="-21" y="100" font-size="11" font-weight="200" fill="yellow">{{(min|0)}}</text> | |
| <text x="-21" y="3" font-size="11" font-weight="200" fill="yellow">{{(max|0)}}</text> | |
| <text x="2" :y="firstValue - 7.5" font-size="11" font-weight="200" | |
| @click="labelClicked($event, values[0], visibleLabels[0])" :fill="labelColor">{{ visibleLabels[0] }}</text> | |
| <text :x="-22+100 * (values.length-1)" :y="lastValue - 7.5" font-size="11" | |
| font-weight="200" @click="labelClicked($event, values[values.length-1], visibleLabels[values.length-1])" | |
| :fill="labelColor">{{ visibleLabels[visibleLabels.length-1] }}</text> | |
| <text v-if="idx !== 0 && idx !== path.length-1" @click="labelClicked($event, values[idx], visibleLabels[idx])" | |
| v-for="([ x, y ], idx) in path" :x="x - 10" :y="y - 7.5" | |
| :key="idx" font-size="11" font-weight="200" :fill="labelColor"> | |
| {{ visibleLabels[idx] }} | |
| </text> | |
| </svg> | |
| <figcaption v-if="!titleTop"> | |
| <p :class="titleClass" class="chart_title">{{title}}</p> | |
| </figcaption> | |
| </figure> | |
| </div> | |
| </template> | |
| <script> | |
| /*! Copyright (c) 2018, Reiner Bamberger (https://github.com/reinerBa). All rights reserved. | |
| * Use of this source code is governed the therms of the MIT license that can be found | |
| * at https://github.com/reinerBa/Vue-Responsive/blob/master/LICENSE | |
| */ | |
| export default { | |
| name: 'simple-svg-chart', | |
| props: { | |
| title: { type: String, default: '' }, // title of the chart | |
| values: { type: Array, default: null }, // the values that shall be displayed | |
| labels: { type: Array, default: null }, // if not the values but other digits should be displayed | |
| titleTop: {type: Boolean, default: true}, // show title on top, needs a title to be defined | |
| titleClass: {type: Array | Object, required: false}, // class to style the title | |
| pathClass: {type: Array | Object, required: false}, // class for the chart line | |
| lineColor: {type: String, default: 'rgba(255, 255, 255, 0.3)'}, // color for the chart line | |
| labelColor: {type: String, default: 'white'}, // color for the labels | |
| showPercent: {type: Boolean, default: false}, // uses y-range from 0 - 100 | |
| valuePostfix: {type: String, default: ''} // puts a postfix char to the values like '%' or '$' | |
| }, | |
| computed: { | |
| pathLength () { | |
| return (this.values.length - 1) * 100 + 25 | |
| }, | |
| yMax () { | |
| return Math.max(...this.values) | |
| }, | |
| yMin () { | |
| return Math.min(...this.values) | |
| }, | |
| path () { | |
| return this.values.map((value, i) => [i * 100, this.stretch(value)]) | |
| }, | |
| firstValue () { | |
| return this.stretch(this.values[0]) | |
| }, | |
| lastValue () { | |
| return this.stretch(this.values[this.values.length - 1]) | |
| }, | |
| max () { | |
| return !this.showPercent ? this.yMax : 100 | |
| }, | |
| min () { | |
| return !this.showPercent ? this.yMin : 0 | |
| }, | |
| scoring () { | |
| return this.showPercent ? 1 : 100 / (this.max - this.min) | |
| }, | |
| visibleLabels () { | |
| if (this.labels) return this.labels | |
| else return this.values.map(e => Math.round(e) + this.valuePostfix) | |
| } | |
| }, | |
| methods: { | |
| stretch (v) { | |
| return 100 - ((v - this.min) * this.scoring) | |
| }, | |
| labelClicked (event, value, label) { | |
| this.$emit('pointClicked', {event, value, label}) | |
| } | |
| } | |
| } | |
| </script> | |
| <style scoped> | |
| text{ | |
| cursor: default; | |
| } | |
| figure { | |
| margin: 0; | |
| } | |
| .chart_title { | |
| color: white; | |
| } | |
| .svg-barchart { | |
| background: darkgreen; | |
| border-radius: 4px; | |
| padding: 20px; | |
| transition: all 0.2s; | |
| } | |
| </style> |
The js-file can be used in every template after
Vue.component('simple', simpleSvgChart)
Sign up for free
to join this conversation on GitHub.
Already have an account?
Sign in to comment
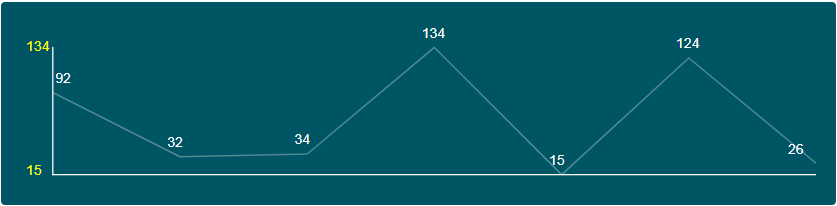
A possible visualisation of the plugin with some random data