Debugging - In this lesson we'll learn about debugging Elixir code as well as static analysis tools to help find potential bugs
The most straightforward tool we have for debugging Elixir code is IEx.
But don't be fooled by its simplicity - you can solve most of the issues with your application by it.
IEx means Elixir's interactive shell.
You could have already seen IEx in one of the previous lessons like Basics where we ran Elixir code interactively in the shell.
The idea here is simple.
You get the interactive shell in the context of the place you want to debug.
Let's try it.
To do that, create a file named test.exs and put this into the file:
defmodule TestMod do
  def sum([a, b]) do
    b = 0

    a + b
  end
end

IO.puts(TestMod.sum([34, 65]))
And if you run it - you'll get an apparent output of 34:
$ elixir test.exs
warning: variable "b" is unused (if the variable is not meant to be used, prefix it with an underscore)
  test.exs:2

34
But now let's get to the exciting part - the debugging.
Put require IEx; IEx.pry in the line after b = 0 and let's try running it once again.
You'll get something like this:
$ elixir test.exs
warning: variable "b" is unused (if the variable is not meant to be used, prefix it with an underscore)
  test.exs:2

Cannot pry #PID<0.92.0> at TestMod.sum/1 (test.exs:5). Is an IEx shell running?
34
You should note that vital message.
When running an application, as usual, IEx outputs this message instead of blocking execution of the program.
To run it properly you need to prepend your command with iex -S.
What this does is it runs mix inside the iex command so that it runs the application in a special mode, such that calls to IEx.pry stop the application execution.
For example, iex -S mix phx.server to debug your Phoenix application.
In our case, it's going to be iex -r test.exs to require the file:
$ iex -r test.exs
Erlang/OTP 21 [erts-10.3.1] [source] [64-bit] [smp:4:4] [ds:4:4:10] [async-threads:1] [hipe] [dtrace]

warning: variable "b" is unused (if the variable is not meant to be used, prefix it with an underscore)
  test.exs:2

Request to pry #PID<0.107.0> at TestMod.sum/1 (test.exs:5)

    3:     b = 0
    4:
    5:     require IEx; IEx.pry
    6:
    7:     a + b

Allow? [Yn]
After responding to the prompt via y or pressing Enter, you've entered the interactive mode.
$ iex -r test.exs
Erlang/OTP 21 [erts-10.3.1] [source] [64-bit] [smp:4:4] [ds:4:4:10] [async-threads:1] [hipe] [dtrace]

warning: variable "b" is unused (if the variable is not meant to be used, prefix it with an underscore)
  test.exs:2

Request to pry #PID<0.107.0> at TestMod.sum/1 (test.exs:5)

    3:     b = 0
    4:
    5:     require IEx; IEx.pry
    6:
    7:     a + b

Allow? [Yn] y
Interactive Elixir (1.8.1) - press Ctrl+C to exit (type h() ENTER for help)
pry(1)> a
34
pry(2)> b
0
pry(3)> a + b
34
pry(4)> continue
34

Interactive Elixir (1.8.1) - press Ctrl+C to exit (type h() ENTER for help)
iex(1)>
BREAK: (a)bort (c)ontinue (p)roc info (i)nfo (l)oaded
       (v)ersion (k)ill (D)b-tables (d)istribution
To quit IEx, you can either hit Ctrl+C two times to exit the app, or type continue to go to the next breakpoint.
As you can see, you can run any Elixir code.
However, the limitation is that you can't modify variables of existing code, due to language immutability.
However, you can get values of all the variables and run any computations.
In this case, the bug would be in b reassigned to 0, and sum function being buggy as a result.
Sure, language has already caught this bug even on the first run, but that's an example!
One of the more annoying parts of working with IEx is it has no history of commands you used in previous runs.
For solving that problem, there is a separate subsection on IEx documentation, where you can find the solution for your platform of choice.
You can also look through the list of other available helpers in IEx.Helpers documentation.
The Dialyzer, a DIscrepancy AnaLYZer for ERlang programs is a tool for static code analysis. In other words they read but do not run code and analyse it e.g. looking for some bugs, dead, unnecessary or unreachable code.
The Dialyxir is a mix task to simplify usage of Dialyzer in Elixir.
Specifications help tools, like Dialyzer, better understand your code.
Unlike documentation, which is human readable (if it exists and is well written), @spec uses a formal syntax better understood by tooling.
Let's add Dialyxir to our project.
The simplest way is to add dependency to mix.exs file:
defp deps do
  [{:dialyxir, "~> 0.4", only: [:dev]}]
end
Then we call:
$ mix deps.get
...
$ mix deps.compile
The first command will download and install Dialyxir. You may be asked to install Hex along with it. The second compiles the Dialyxir application. If you want to install Dialyxir globally, please read its documentation.
The last step is to run Dialyzer to rebuild the PLT (Persistent Lookup Table). You need to do this every time after installation of a new version of Erlang or Elixir. Fortunately, Dialyzer will not try to analyze standard library every time that you try to use it. It takes a few minutes for the download to complete.
$ mix dialyzer --plt
Starting PLT Core Build ...
this will take awhile
dialyzer --build_plt --output_plt /.dialyxir_core_18_1.3.2.plt --apps erts kernel stdlib crypto public_key -r /Elixir/lib/elixir/../eex/ebin /Elixir/lib/elixir/../elixir/ebin /Elixir/lib/elixir/../ex_unit/ebin /Elixir/lib/elixir/../iex/ebin /Elixir/lib/elixir/../logger/ebin /Elixir/lib/elixir/../mix/ebin
  Creating PLT /.dialyxir_core_18_1.3.2.plt ...
...
 done in 5m14.67s
done (warnings were emitted)Now we're ready to use Dialyxir:
$ mix dialyzer
...
examples.ex:3: Invalid type specification for function 'Elixir.Examples':sum_times/1.
The success typing is (_) -> number()
...
The message from Dialyzer is clear: the return type of our function sum_times/1 is different than declared.
This is because Enum.sum/1 returns a number and not a integer but the return type of sum_times/1 is integer.
Since number is not integer we get an error.
How do we fix it? We need to use the round/1 function to change our number to an integer:
@spec sum_times(integer) :: integer
def sum_times(a) do
  [1, 2, 3]
  |> Enum.map(fn el -> el * a end)
  |> Enum.sum()
  |> round
end
Finally:
$ mix dialyzer
...
  Proceeding with analysis...
done in 0m0.95s
done (passed successfully)
Using specifications with tools to perform static code analysis helps us make code that is self-tested and contains less bugs.
Sometimes static analysis of code is not enough.
It may be necessary to understand the execution flow in order to find bugs.
The simplest way is to put output statements in our code like IO.puts/2 to track values and code flow, but this technique is primitive and has limitations.
Thankfully for us, we can use the Erlang debugger to debug our Elixir code.
Let’s look at a basic module:
defmodule Example do
  def cpu_burns(a, b, c) do
    x = a * 2
    y = b * 3
    z = c * 5

    x + y + z
  end
end
Then run iex:
iex -S mixAnd run debugger:
iex > :debugger.start()
{:ok, #PID<0.307.0>}
The Erlang :debugger module provides access to the debugger.
We can use the start/1 function to configure it:
- An external configuration file can be used by passing the file path.
- If the argument is
:localor:globalthen debugger will::global– debugger will interpret code on all known nodes. This is default value.:local– debugger will interpret code only on current node.
The next step is to attach our module to debugger:
iex > :int.ni(Example)
{:module, Example}
The :int module is an interpreter that gives us the ability to create breakpoints and step through the execution of the code.
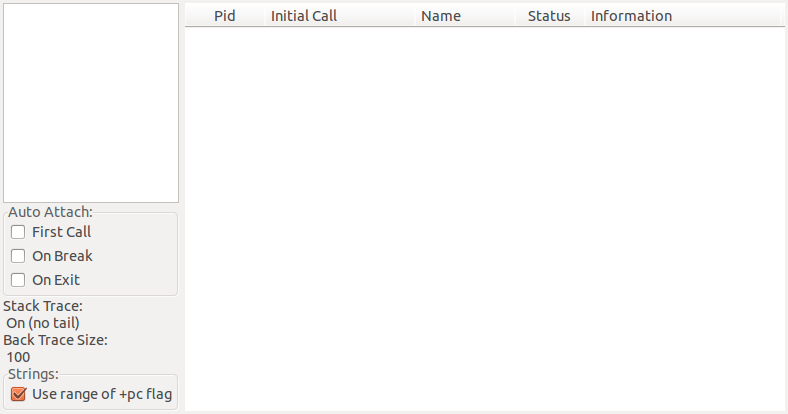
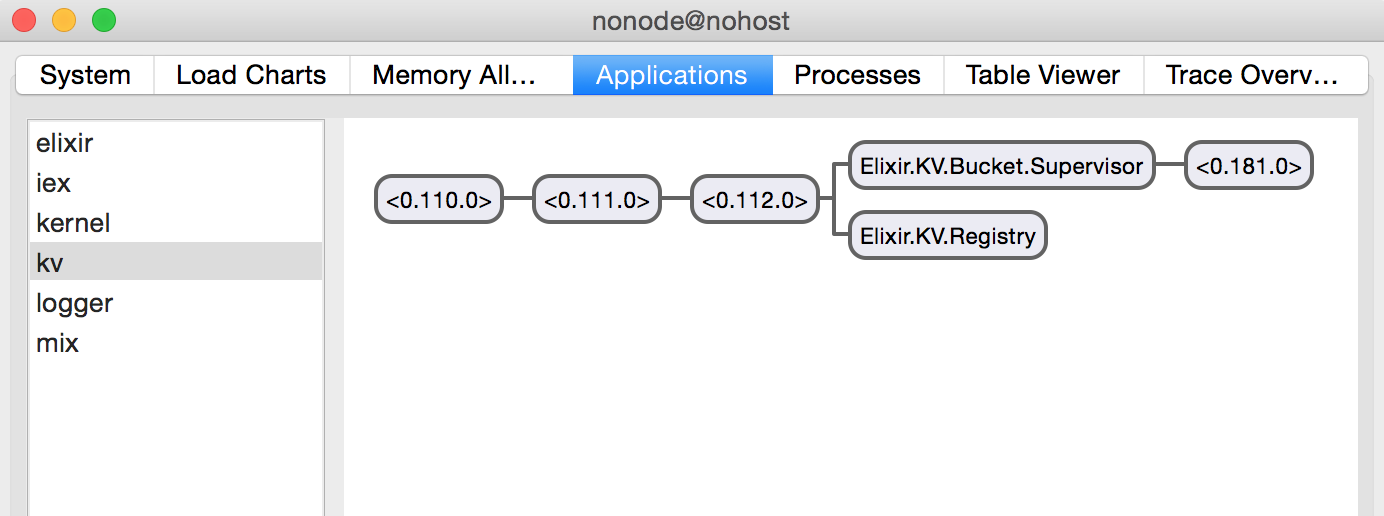
When you start the debugger you will see a new window like this:
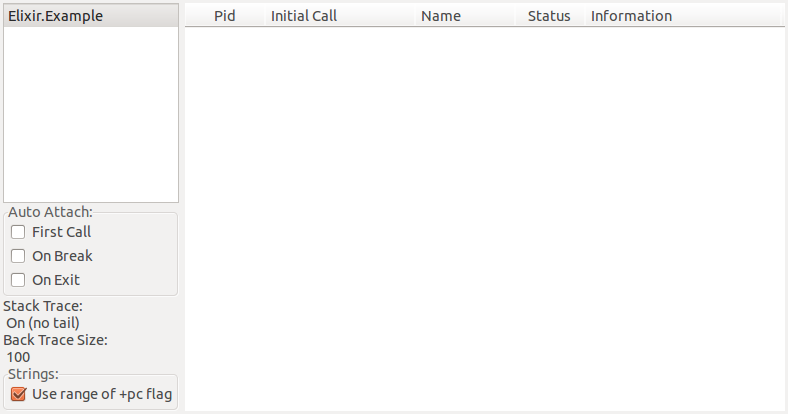
After we've attached our module to the debugger it will be available in the menu on the left:
A breakpoint is a point in the code where execution will be halted. We have two ways of creating breakpoints:
:int.break/2in our code- The debugger's UI
Let's try to create a breakpoint in IEx:
iex > :int.break(Example, 8)
:ok
This sets a breakpoint on line 8 of the Example module.
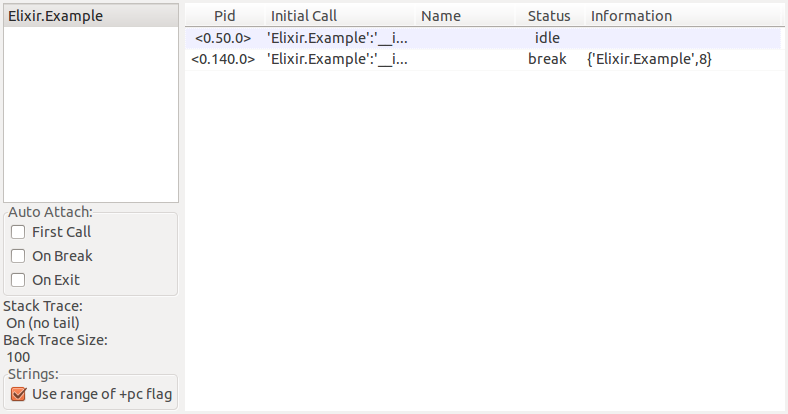
Now when we call our function:
iex > Example.cpu_burns(1, 1, 1)Execution will be paused in IEx and the debugger window should look like this:
An additional window with our source code will appear:
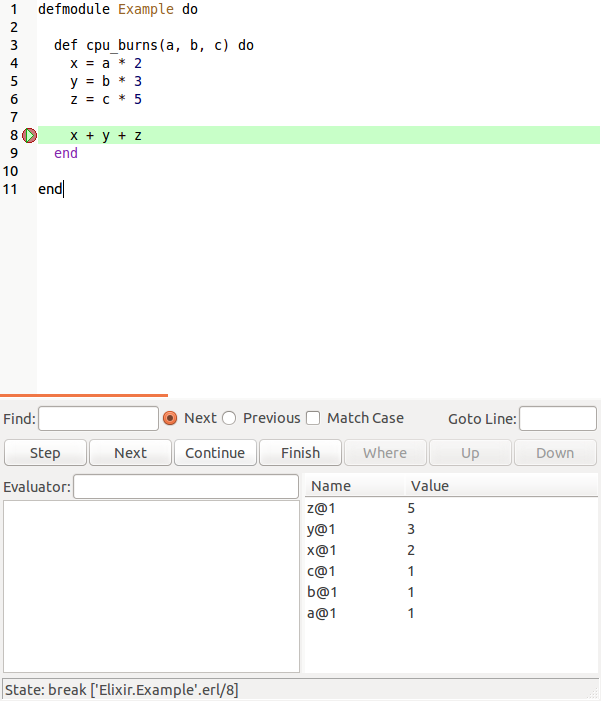
In this window we can look up the value of variables, step forward to next line, or evaluate expressions.
:int.disable_break/2 can be called in order to disable a breakpoint:
iex > :int.disable_break(Example, 8)
:ok
To re-enable a breakpoint we can call :int.enable_break/2 or we can remove a breakpoint like this:
iex > :int.delete_break(Example, 8)
:ok
The same operations are available in the debugger window. In the top menu, Break, we can select Line Break and setup breakpoints. If we select a line that does not contain code then breakpoints will be ignored, but it will appear in the debugger window. There are three types of breakpoints:
- Line breakpoint — debugger suspends execution when we reach the line, setup with
:int.break/2 - Conditional breakpoint — similar to the line breakpoint but the debugger suspends only when the specified condition is reached, these are setup using
:int.get_binding/2 - Function breakpoint — debugger will suspend on first line of a function, configured using
:int.break_in/3
That's all! Happy debugging!
https://elixirschool.com/en/lessons/misc/debugging
https://elixir-lang.org/getting-started/debugging.html#observer