-
-
Save rmarren1/d593535900f0da0ad52e8a160f3767bd to your computer and use it in GitHub Desktop.
| import numpy as np | |
| import plotly.graph_objs as go | |
| import colorlover as cl | |
| def get_spaced_colors(n, randomized=False): | |
| if n > 0: | |
| max_value = 255 | |
| interval = max_value / n | |
| hues = np.arange(0, max_value, interval) | |
| return cl.to_rgb(["hsl(%d,80%%,40%%)" % i for i in hues]) | |
| else: | |
| return None | |
| PI = np.pi | |
| def check_square(M): | |
| d, n = M.shape | |
| if d != n: | |
| raise ValueError("Data array must be square.") | |
| return n | |
| def moduloAB(x, a, b): | |
| if a >= b: | |
| raise ValueError('Incorrect inverval ends') | |
| y = (x - a) % (b - a) | |
| return y + b if y < 0 else y + a | |
| def test_2PI(x): | |
| return 0 <= x < 2 * PI | |
| def get_ideogram_ends(ideaogram_len, gap): | |
| ideo_ends = [] | |
| left = 0 | |
| for k in range(len(ideaogram_len)): | |
| right = left + ideaogram_len[k] | |
| ideo_ends.append([left, right]) | |
| left = right + gap | |
| return ideo_ends | |
| def make_ideogram_arc(R, phi, a=50): | |
| # R is the circle radius | |
| # Phi is a list of the ends angle coordinates of an arc | |
| # a is a parameter that controls the number of points to be evaluated | |
| if not test_2PI(phi[0]) or not test_2PI(phi[1]): | |
| phi = [moduloAB(t, 0, 2*PI) for t in phi] | |
| length = (phi[1] - phi[0]) % 2 * PI | |
| nr = 5 if length <= PI/4 else int(a * length / PI) | |
| if phi[0] < phi[1]: | |
| theta = np.linspace(phi[0], phi[1], nr) | |
| else: | |
| phi = [moduloAB(t, -PI, PI) for t in phi] | |
| theta = np.linspace(phi[0], phi[1], nr) | |
| return R * np.exp(1j*theta) | |
| def map_data(data_matrix, row_value, ideogram_length): | |
| n = data_matrix.shape[0] # square, so same as 1 | |
| mapped = np.zeros([n, n]) | |
| for j in range(n): | |
| mapped[:, j] = ideogram_length * data_matrix[:, j] / row_value | |
| return mapped | |
| def make_ribbon_ends(mapped_data, ideo_ends, idx_sort): | |
| n = mapped_data.shape[0] | |
| ribbon_boundary = np.zeros((n, n+1)) | |
| for k in range(n): | |
| start = ideo_ends[k][0] | |
| ribbon_boundary[k][0] = start | |
| for j in range(1, n+1): | |
| J = idx_sort[k][j-1] | |
| ribbon_boundary[k][j] = start + mapped_data[k][J] | |
| start = ribbon_boundary[k][j] | |
| return [[(ribbon_boundary[k][j], ribbon_boundary[k][j+1]) | |
| for j in range(n)] for k in range(n)] | |
| def control_pts(angle, radius): | |
| if len(angle) != 3: | |
| raise ValueError('Angle must have len = 3') | |
| b_cplx = np.array([np.exp(1j*angle[k]) for k in range(3)]) | |
| b_cplx[1] = radius * b_cplx[1] | |
| return list(zip(b_cplx.real, b_cplx.imag)) | |
| def ctrl_rib_chords(l, r, radius): | |
| if len(l) != 2 or len(r) != 2: | |
| raise ValueError('The arc ends must be elements in a list of len 2') | |
| return [control_pts([l[j], (l[j]+r[j])/2, r[j]], radius) for j in range(2)] | |
| def make_q_bezier(b): | |
| if len(b) != 3: | |
| raise ValueError('Contaol polygon must have 3 points') | |
| A, B, C = b | |
| return 'M ' + str(A[0]) + "," + str(A[1]) + " " + "Q " + \ | |
| str(B[0]) + ", " + str(B[1]) + " " + \ | |
| str(C[0]) + ", " + str(C[1]) | |
| def make_ribbon_arc(theta0, theta1): | |
| if test_2PI(theta0) and test_2PI(theta1): | |
| if theta0 < theta1: | |
| theta0 = moduloAB(theta0, -PI, PI) | |
| theta1 = moduloAB(theta1, -PI, PI) | |
| if theta0 * theta1 > 0: | |
| raise ValueError('Incorrect angle coordinates for ribbon') | |
| nr = int(40 * (theta0 - theta1) / PI) | |
| if nr <= 2: | |
| nr = 3 | |
| theta = np.linspace(theta0, theta1, nr) | |
| pts = np.exp(1j * theta) | |
| string_arc = '' | |
| for k in range(len(theta)): | |
| string_arc += "L " + str(pts.real[k]) + ", " + str(pts.imag[k])+' ' | |
| return string_arc | |
| else: | |
| raise ValueError('The angle coords for arc ribbon must be [0, 2*PI]') | |
| def make_layout(title): | |
| xaxis = dict(showline=False, | |
| zeroline=False, | |
| showgrid=False, | |
| showticklabels=False, | |
| title='') | |
| yaxis = {**xaxis, 'scaleanchor': 'x'} | |
| return dict(title=title, | |
| xaxis=xaxis, | |
| yaxis=yaxis, | |
| showlegend=False, | |
| margin=dict(t=25, b=25, l=25, r=25), | |
| hovermode='closest', | |
| shapes=[]) | |
| def make_ideo_shape(path, line_color, fill_color): | |
| return dict( | |
| line=go.Line(color=line_color, width=0.45), | |
| path=path, | |
| type='path', | |
| fillcolor=fill_color, | |
| layer='below' | |
| ) | |
| def make_ribbon(l, r, line_color, fill_color, radius=0.2): | |
| poligon = ctrl_rib_chords(l, r, radius) | |
| b, c = poligon | |
| return dict(line=go.Line(color=line_color, width=0.5), | |
| path=make_q_bezier(b) + make_ribbon_arc(r[0], r[1]) + | |
| make_q_bezier(c[::-1]) + make_ribbon_arc(l[1], l[0]), | |
| type='path', | |
| fillcolor=fill_color, | |
| layer='below') | |
| def make_self_rel(l, line_color, fill_color, radius): | |
| b = control_pts([l[0], (l[0]+l[1])/2, l[1]], radius) | |
| return dict( | |
| line=dict(color=line_color, width=0.5), | |
| path=make_q_bezier(b) + make_ribbon_arc(l[1], l[0]), | |
| type='path', | |
| fillcolor=fill_color, | |
| layer='below' | |
| ) | |
| def invPerm(perm): | |
| inv = [0] * len(perm) | |
| for i, s in enumerate(perm): | |
| inv[s] = i | |
| return inv | |
| def make_filled_chord(M): | |
| n = M.shape[0] | |
| labels = M.columns | |
| M = M.T | |
| matrix = M.as_matrix() | |
| row_sum = [np.sum(matrix[k, :]) for k in range(n)] | |
| gap = 2 * PI * 10e-8 | |
| ideogram_length = 2*PI*np.asarray(row_sum)/sum(row_sum) - gap*np.ones(n) | |
| ideo_colors = [x[:3] + "a" + x[3:-1] + ",.75" + x[-1] for x in | |
| get_spaced_colors(len(labels))] | |
| mapped_data = map_data(M.as_matrix(), row_sum, ideogram_length) | |
| idx_sort = np.argsort(mapped_data, axis=1) | |
| ideo_ends = get_ideogram_ends(ideogram_length, gap) | |
| ribbon_ends = make_ribbon_ends(mapped_data, ideo_ends, idx_sort) | |
| ribbon_color = [n * [ideo_colors[k]] for k in range(n)] | |
| layout = make_layout(' ') | |
| ribbon_info = [] | |
| radii_sribb = [0.2] * n | |
| for k in range(n): | |
| sigma = idx_sort[k] | |
| sigma_inv = invPerm(sigma) | |
| for j in range(k, n): | |
| if M.iloc[k, j] == 0 and M.iloc[j, k] == 0: | |
| continue | |
| eta = idx_sort[j] | |
| eta_inv = invPerm(eta) | |
| l = ribbon_ends[k][sigma_inv[j]] | |
| if j == k: | |
| layout['shapes'].append( | |
| make_self_rel(l, | |
| 'rgb(175,175,175)', | |
| ideo_colors[k], | |
| radius=radii_sribb[k])) | |
| z = 0.9 * np.exp(1j * (l[0] + l[1]) / 2) | |
| text = labels[k] + " co-occurs with " + \ | |
| "{:d}".format(M.iloc[k, k]) + " of its own appearences" | |
| ribbon_info.append( | |
| go.Scatter(x=[z.real], | |
| y=[z.imag], | |
| mode='markers', | |
| text=text, | |
| hoverinfo="text", | |
| marker=dict(size=0.5, | |
| color=ideo_colors[k]))) | |
| else: | |
| r = ribbon_ends[j][eta_inv[k]] | |
| zi = 0.9 * np.exp(1j * (l[0] + l[1]) / 2) | |
| zf = 0.9 * np.exp(1j * (r[0] + r[1]) / 2) | |
| texti = labels[k] + " co-occurs with " + \ | |
| "{:d}".format(matrix[k][j]) + " of the " + \ | |
| labels[j] + " appearences" | |
| textf = labels[j] + " co-occurs with " + \ | |
| "{:d}".format(matrix[j][k]) + " of the " + \ | |
| labels[k] + " appearences" | |
| ribbon_info.append( | |
| go.Scatter(x=[zi.real], | |
| y=[zi.imag], | |
| mode='markers', | |
| text=texti, | |
| hoverinfo="text", | |
| marker=dict(size=0.5, | |
| color=ribbon_color[k][j]))) | |
| ribbon_info.append( | |
| go.Scatter(x=[zf.real], | |
| y=[zf.imag], | |
| mode='markers', | |
| text=textf, | |
| hoverinfo="text", | |
| marker=dict(size=0.5, | |
| color=ribbon_color[j][k]))) | |
| r = (r[1], r[0]) | |
| if matrix[k][j] > matrix[j][k]: | |
| color_of_highest = ribbon_color[k][j] | |
| else: | |
| color_of_highest = ribbon_color[j][k] | |
| layout['shapes'].append( | |
| make_ribbon(l, r, 'rgb(175, 175, 175)', | |
| color_of_highest)) | |
| ideograms = [] | |
| for k in range(len(ideo_ends)): | |
| z = make_ideogram_arc(1.1, ideo_ends[k]) | |
| zi = make_ideogram_arc(1.0, ideo_ends[k]) | |
| m = len(z) | |
| n = len(zi) | |
| ideograms.append( | |
| go.Scatter(x=z.real, | |
| y=z.imag, | |
| mode='lines', | |
| line=dict(color=ideo_colors[k], | |
| shape='spline', | |
| width=0.25), | |
| text=labels[k]+'<br>'+'{:d}'.format(row_sum[k]), | |
| hoverinfo='text')) | |
| path = 'M ' | |
| for s in range(m): | |
| path += str(z.real[s]) + ', ' + str(z.imag[s]) + ' L ' | |
| Zi = np.array(zi.tolist()[::-1]) | |
| for s in range(m): | |
| path += str(Zi.real[s]) + ", " + str(Zi.imag[s]) + ' L ' | |
| path += str(z.real[0]) + ' ,' + str(z.imag[0]) | |
| layout['shapes'].append(make_ideo_shape(path, | |
| 'rgb(150,150,150)', | |
| ideo_colors[k])) | |
| data = ideograms + ribbon_info | |
| fig = { | |
| "data": data, | |
| "layout": layout | |
| } | |
| return fig |
rmarren1
commented
Mar 30, 2018
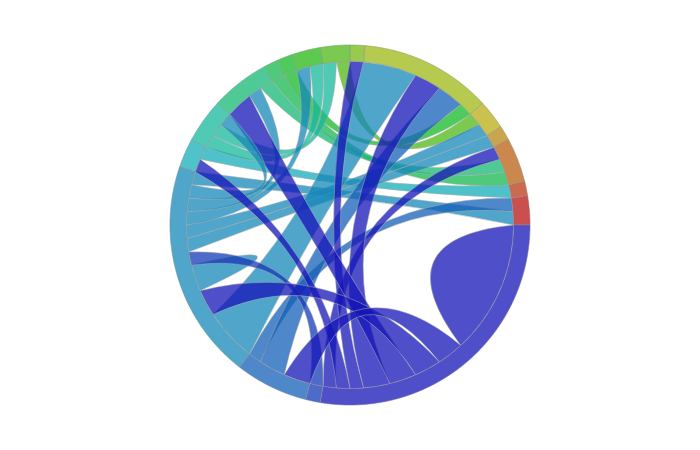
Input is a square pandas matrix where cell i, j is the i -> j relationship depicted in the diagram.
I hacked this code a bit more.
Fixes:
- stopped ideogram circle approximation from becoming distorted N nodes>100 (hundreds).
- made compatible with latest data frame/numpy syntax.
https://github.com/russelljjarvis/CoauthorNetVis/blob/master/chord2.py - made a live version of the chord on streamlit.
CoauthorNetVis
CoauthorNetVis
Live version of application
Hello, I am looking at using a chord plot like this one. I find that when I add a large amount of data I get a value error 'Incorrect angle coordinates for ribbon'. I am not really sure how to resolve this error. Could you provide some advice please?
@rmarren1 and @russelljjarvis Thank you both for picking up the code for Chord Diagram into a few functions. I edited and posted this notebook https://github.com/empet/Plotly-plots/blob/master/Chord-diagram.ipynb, as a tutorial, late in 2015 (an older version than that on github is this one: https://plotly.com/python/v3/filled-chord-diagram/). Meanwhile I updated it to work with newer Plotly versions, and replaced Python 2 string manipulation with f-strings (see the github version).