Created
May 6, 2022 10:21
-
-
Save s417-lama/f489251d514cdf5891900237e75edaec to your computer and use it in GitHub Desktop.
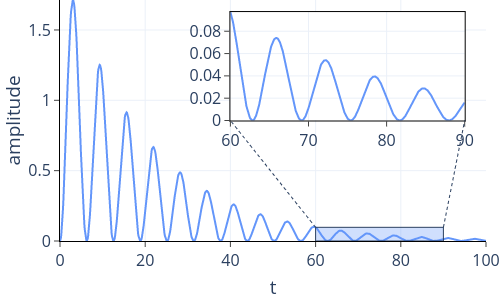
Zoom-in (inset) plot example in plotly.py
This file contains bidirectional Unicode text that may be interpreted or compiled differently than what appears below. To review, open the file in an editor that reveals hidden Unicode characters.
Learn more about bidirectional Unicode characters
| import math | |
| import numpy as np | |
| import plotly.graph_objects as go | |
| import plotly.io as pio | |
| # plotly figure | |
| pio.templates.default = "plotly_white" | |
| fig = go.Figure() | |
| # damped oscillation | |
| def fn(x): | |
| return math.exp(-0.05 * x) * (1 - math.cos(x)) | |
| n_samples = 1000 | |
| # main plot | |
| x0 = 0 | |
| x1 = 100 | |
| xs = np.linspace(x0, x1, n_samples) | |
| ys = [fn(x) for x in xs] | |
| y0 = 0 | |
| y1 = max(ys) | |
| fig.add_trace(go.Scatter(x=xs, | |
| y=ys, | |
| mode="lines", | |
| line_color="rgb(100,150,250)")) | |
| # area to zoom in | |
| zoom_x0 = 60 | |
| zoom_x1 = 90 | |
| zoom_xs = np.linspace(zoom_x0, zoom_x1, n_samples) | |
| zoom_ys = [fn(x) for x in zoom_xs] | |
| zoom_y0 = 0 | |
| zoom_y1 = max(zoom_ys) | |
| fig.add_trace(go.Scatter(x=zoom_xs, | |
| y=zoom_ys, | |
| mode="lines", | |
| xaxis="x2", | |
| yaxis="y2", | |
| line_color="rgb(100,150,250)")) | |
| # position of the zoomed area | |
| subplot_x0 = 0.4 | |
| subplot_x1 = 0.95 | |
| subplot_y0 = 0.5 | |
| subplot_y1 = 0.95 | |
| # shapes to indicate which area is zoomed in | |
| fig.add_shape( | |
| type="rect", | |
| x0=zoom_x0, | |
| y0=zoom_y0, | |
| x1=zoom_x1, | |
| y1=zoom_y1, | |
| fillcolor="rgba(100,150,250,0.3)", | |
| line_width=1, | |
| ) | |
| fig.add_shape( | |
| type="line", | |
| x0=zoom_x0, | |
| y0=zoom_y1, | |
| x1=x0 + (x1 - x0) * subplot_x0, | |
| y1=y0 + (y1 - y0) * subplot_y0, | |
| line_width=1, | |
| line_dash="dot", | |
| ) | |
| fig.add_shape( | |
| type="line", | |
| x0=zoom_x1, | |
| y0=zoom_y1, | |
| x1=x0 + (x1 - x0) * subplot_x1, | |
| y1=y0 + (y1 - y0) * subplot_y0, | |
| line_width=1, | |
| line_dash="dot", | |
| ) | |
| # layout | |
| fig.update_xaxes( | |
| title_text="t", | |
| linecolor="black", | |
| ticks="outside", | |
| range=[x0, x1], | |
| ) | |
| fig.update_yaxes( | |
| title_text="amplitude", | |
| linecolor="black", | |
| ticks="outside", | |
| range=[y0, y1], | |
| ) | |
| fig.update_layout( | |
| width=500, | |
| height=300, | |
| margin=dict(l=0, r=0, b=0, t=0), | |
| font_size=16, | |
| showlegend=False, | |
| xaxis2=dict( | |
| domain=[subplot_x0, subplot_x1], | |
| anchor="y2", | |
| linecolor="black", | |
| mirror=True, | |
| ticks="outside", | |
| range=[zoom_x0, zoom_x1], | |
| ), | |
| yaxis2=dict( | |
| domain=[subplot_y0, subplot_y1], | |
| anchor="x2", | |
| linecolor="black", | |
| mirror=True, | |
| ticks="outside", | |
| rangemode="tozero", | |
| range=[zoom_y0, zoom_y1], | |
| ), | |
| ) | |
| fig.show() |
Sign up for free
to join this conversation on GitHub.
Already have an account?
Sign in to comment
Output: