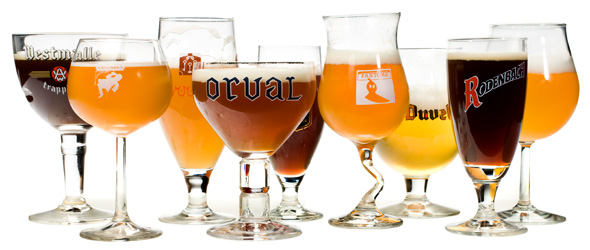
For the past couple of years, I have been preaching the Neo4j gospel in many different places, meetups, conferences, and what have you. For the most part, I have been using a very specific demo that has been super well-received: The Belgian Beer Graph. It started out as a learning experience for me personally back in the day when Neo4j did not have any proper data import functionality - and I had to load the graph by jumping through all kinds of hoops.
This file contains bidirectional Unicode text that may be interpreted or compiled differently than what appears below. To review, open the file in an editor that reveals hidden Unicode characters.
Learn more about bidirectional Unicode characters
| @GrabResolver(name="neo4j", root="http://m2.neo4j.org/") | |
| @GrabResolver(name="restlet", root="http://maven.restlet.org/") | |
| @GrabConfig(systemClassLoader = true) | |
| @Grab('org.neo4j:neo4j-jdbc:2.1.4') | |
| import groovy.sql.* | |
| def sql = Sql.newInstance('jdbc:neo4j://localhost:7474/') | |
| def titles=["abc","def","ghi"] | |
| titles.each { | |
| sql.execute """ |
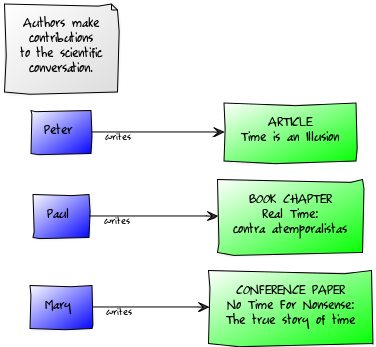
Academic research largely consists in reading and writing texts. These texts can be modelled as a conversation. To be a reasercher, on this model, is to enter into a scientific conversation, to listen (read) and occassionaly to speak (write).
Texts embodying contributions to the scientific conversation are published as book chapters, articles in peer reviewed journals, conference papers &c. For the individual researcher, a major task involves identifying which of these published items are relevant to one’s research, to be able to study them and to respond.
This file contains bidirectional Unicode text that may be interpreted or compiled differently than what appears below. To review, open the file in an editor that reveals hidden Unicode characters.
Learn more about bidirectional Unicode characters
| = Car manufacturers 2013 | |
| This is a graph of all the major car manufacturers and their earnings in 2013, alongside all of their main suppliers. | |
| It also shows the relationships between the various manufactures: cooperations, jointventuress and stock ownership. and the type of those | |
| relationships.(For example a cooperation can be of the type: research/development) | |
| //hide |
NewerOlder

