Created
July 24, 2019 18:35
-
-
Save sergiolucero/16442642ef1e7d0a4c739d4f195e1a01 to your computer and use it in GitHub Desktop.
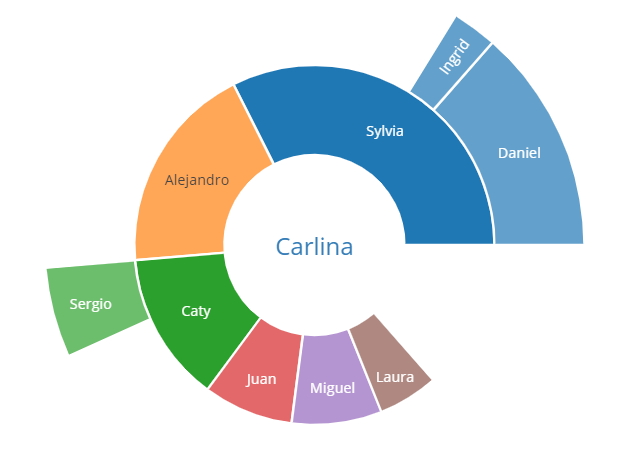
sunburst graph in plot.ly
This file contains bidirectional Unicode text that may be interpreted or compiled differently than what appears below. To review, open the file in an editor that reveals hidden Unicode characters.
Learn more about bidirectional Unicode characters
| import plotly.graph_objs as go | |
| from plotly.offline import download_plotlyjs, init_notebook_mode, plot, iplot | |
| from IPython.display import HTML | |
| trace = go.Sunburst( | |
| labels=["Carlina", "Alejandro", "Sylvia", "Daniel", "Ingrid", "Juan", "Caty", "Sergio", "Laura", "Miguel"], | |
| parents=["", "Carlina", "Carlina", "Sylvia", "Sylvia", "Carlina", "Carlina", "Caty", "Carlina", "Carlina"], | |
| values=[10, 14, 12, 10, 2, 6, 6, 4, 4, 6], | |
| outsidetextfont = {"size": 20, "color": "#377eb8"}, marker = {"line": {"width": 2}}, | |
| ) | |
| layout = go.Layout(margin = go.layout.Margin(t=0, l=0, r=0, b=0)) | |
| fn = 'basic_sunburst_chart.html' | |
| plot(go.Figure([trace], layout), filename=fn) | |
| HTML(open(fn).read()) |
Author
sergiolucero
commented
Jul 24, 2019
Sign up for free
to join this conversation on GitHub.
Already have an account?
Sign in to comment