I just found the following article in the OpenTelemetry blog
Announcing a Community Demo for OpenTelemetry
https://opentelemetry.io/blog/2022/demo-announcement/
This is a demo kit for OpenTelemetry, where an e-commerce site is built with microservices in various languages. In addition, metrics and traces are already instrumented, and if you have a Docker environment at hand, you can just docker compose up to get it running.
As a demonstration of OpenTelemetry, you can see traces and metrics in Jeager and Prometheus. In this article, I would like to send them to Datadog so that I can see them in Datadog.
It consists of several microservices, each in a different language. (Image taken from README.)
graph TD
subgraph Service Diagram
adservice(Ad Service):::java
cache[(Cache<br/>(redis))]
cartservice(Cart Service):::dotnet
checkoutservice(Checkout Service):::golang
currencyservice(Currency Service):::cpp
emailservice(Email Service):::ruby
frontend(Frontend):::golang
loadgenerator([Load Generator]):::python
paymentservice(Payment Service):::nodejs
productcatalogservice(ProductCatalog Service):::golang
recommendationservice(Recommendation Service):::python
shippingservice(Shipping Service):::rust
Internet -->|HTTP| frontend
loadgenerator -->|HTTP| frontend
checkoutservice --> cartservice --> cache
checkoutservice --> productcatalogservice
checkoutservice --> currencyservice
checkoutservice --> emailservice
checkoutservice --> paymentservice
checkoutservice --> shippingservice
checkoutservice --> |evalFlag| featureflagfeservice
frontend --> adservice
frontend --> cartservice
frontend --> productcatalogservice
frontend --> checkoutservice
frontend --> currencyservice
frontend --> recommendationservice --> productcatalogservice
frontend --> shippingservice
frontend --> |evalFlag| featureflagfeservice
productcatalogservice --> |evalFlag| featureflagfeservice
featureflagbeservice(Flag Server):::erlang
featureflagfeservice(Flag UI/API):::erlang
featureflagstore[(Flag Store<br/>(PostgreSQL DB))]
featureflagfeservice --> featureflagbeservice --> featureflagstore
end
classDef java fill:#b07219,color:white;
classDef dotnet fill:#178600,color:white;
classDef golang fill:#00add8,color:black;
classDef cpp fill:#f34b7d,color:white;
classDef ruby fill:#701516,color:white;
classDef python fill:#3572A5,color:white;
classDef nodejs fill:#f1e05a,color:black;
classDef rust fill:#dea584,color:black;
classDef erlang fill:#b83998,color:white;
classDef php fill:#4f5d95,color:white;
graph TD
subgraph Service Legend
  javasvc(Java):::java
  dotnetsvc(.NET):::dotnet
  golangsvc(Go):::golang
  cppsvc(C++):::cpp
  rubysvc(Ruby):::ruby
  pythonsvc(Python):::python
  nodesvc(Node.js):::nodejs
  rustsvc(Rust):::rust
  erlangsvc(Erlang/Elixir):::erlang
end

classDef java fill:#b07219,color:white;
classDef dotnet fill:#178600,color:white;
classDef golang fill:#00add8,color:black;
classDef cpp fill:#f34b7d,color:white;
classDef ruby fill:#701516,color:white;
classDef python fill:#3572A5,color:white;
classDef nodejs fill:#f1e05a,color:black;
classDef rust fill:#dea584,color:black;
classDef erlang fill:#b83998,color:white;
classDef php fill:#4f5d95,color:white;
Clone the Github repository and docker compose up to get it running. It will take a while to build the first time.
Webstore Demo
https://github.com/open-telemetry/opentelemetry-demo
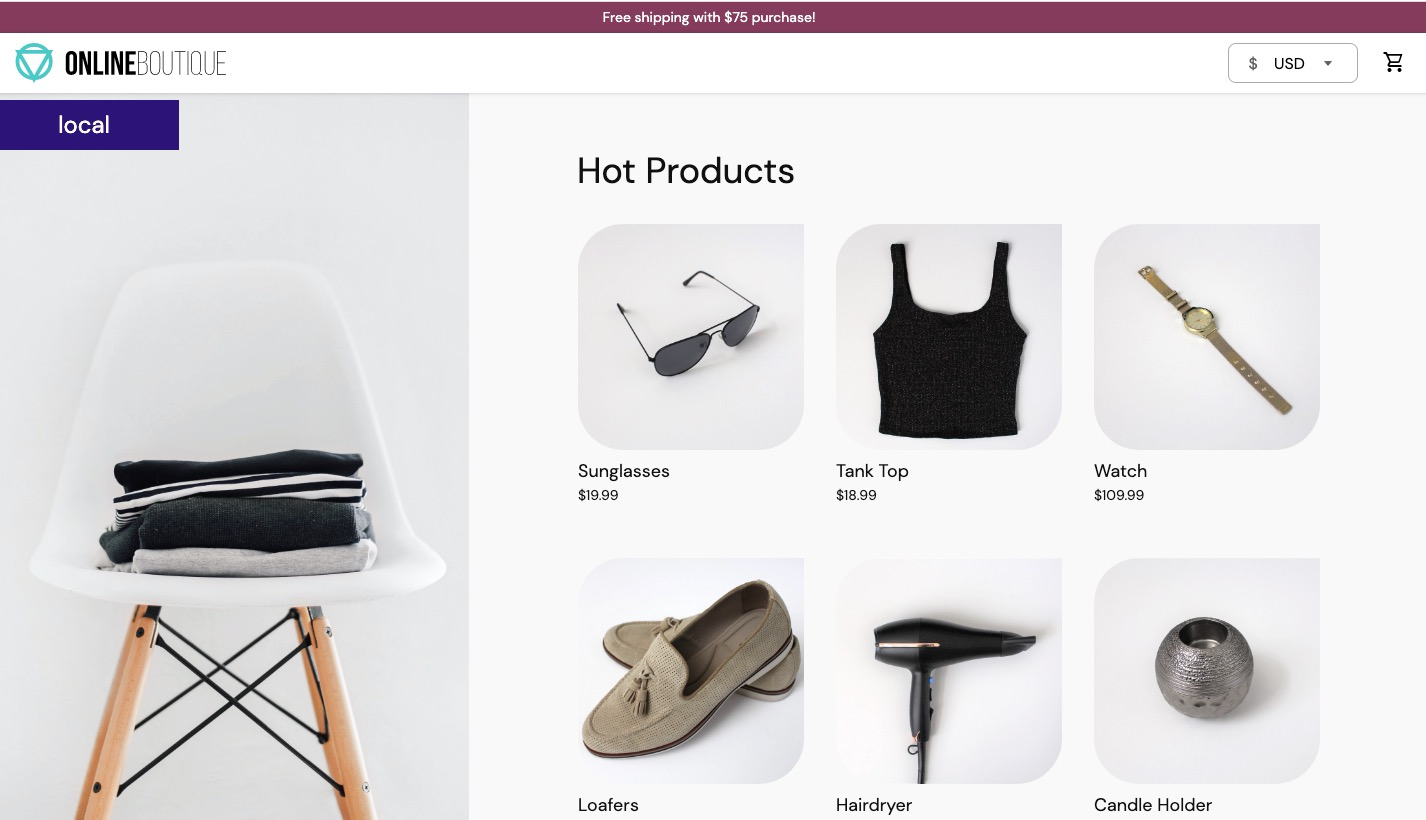
Once up and running, access http://localhost:8080 in your browser and you will see the following EC site.
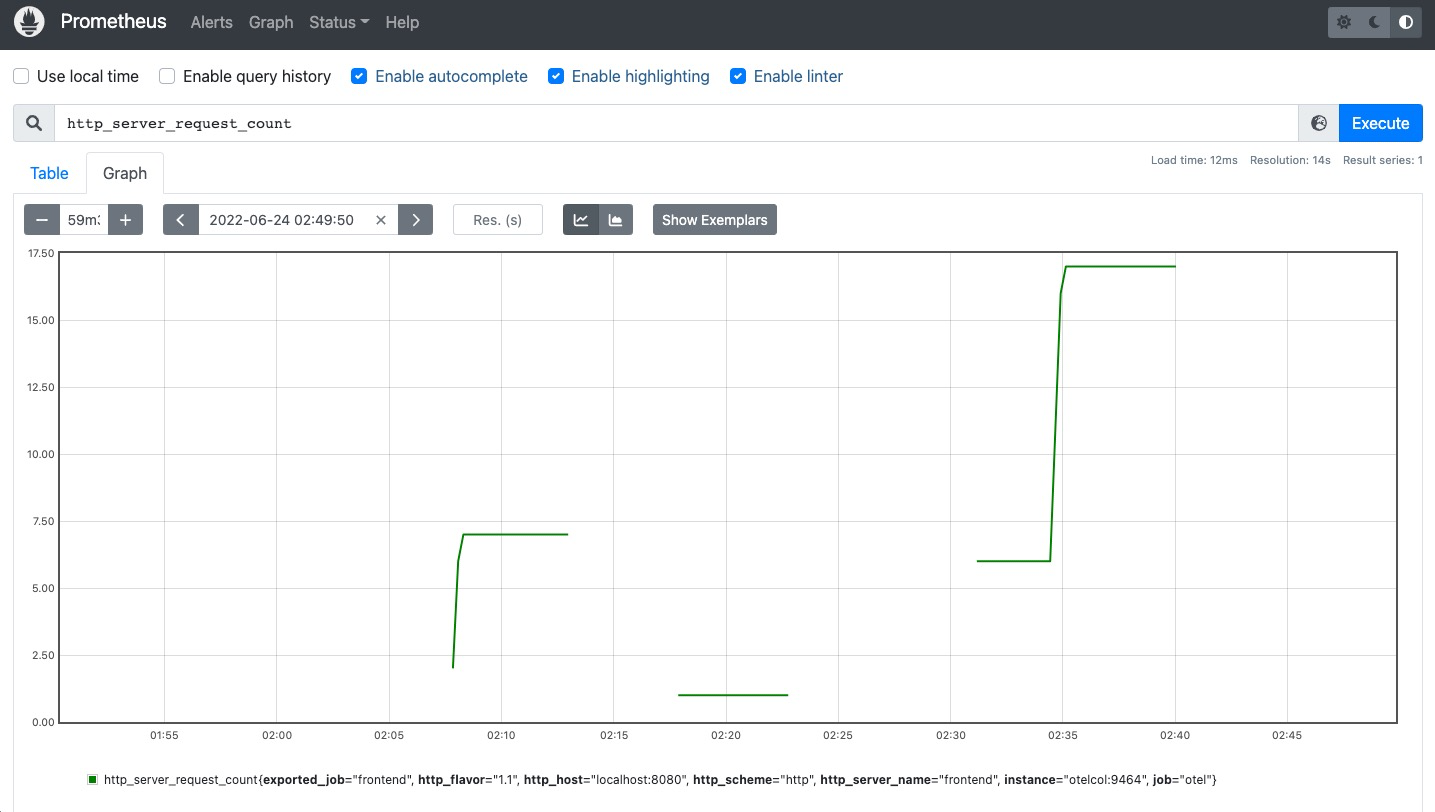
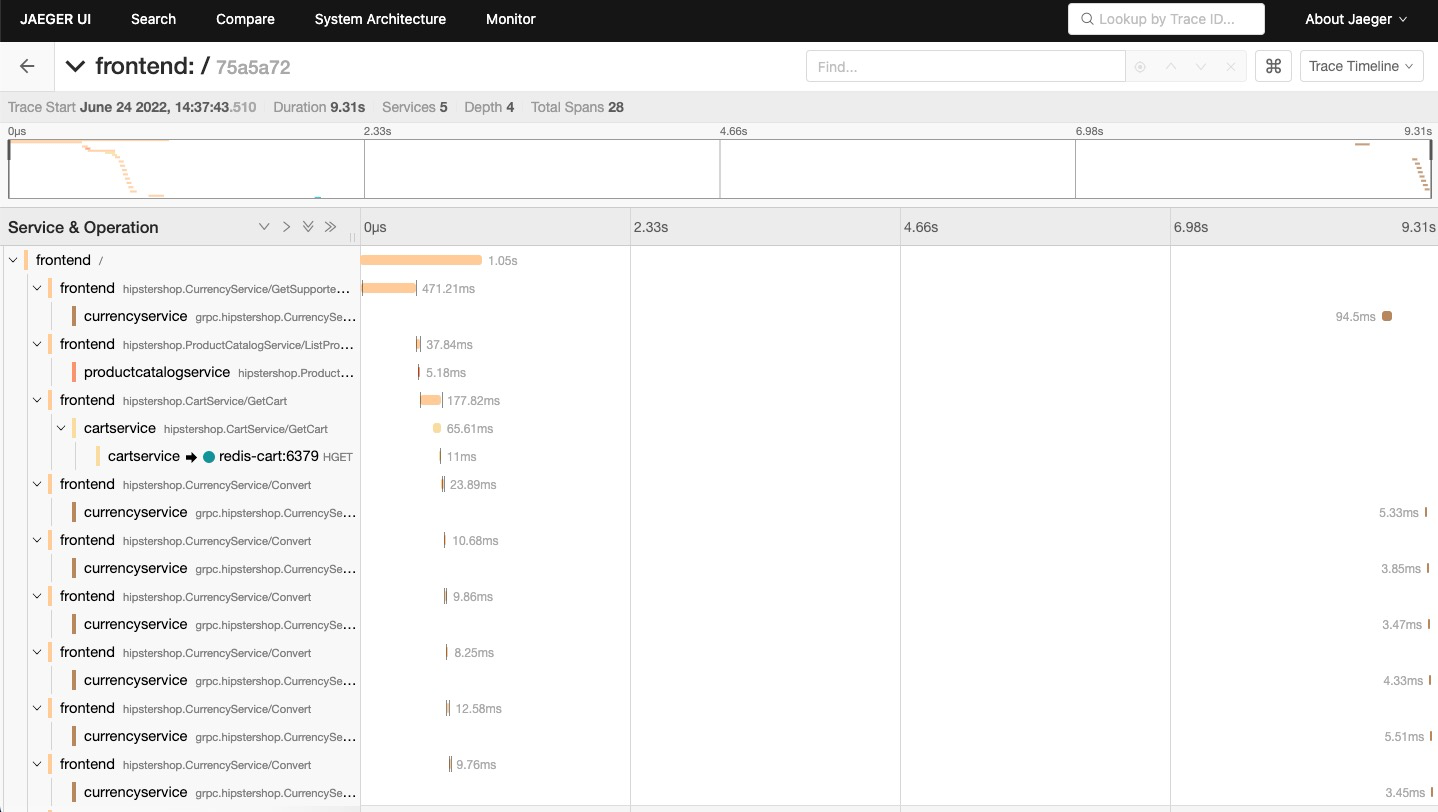
Similarly, you can access Prometheus at http://localhost:9090 and Jeager at http://localhost:16686.
Now let's send these metrics and traces to Datadog, which is a beta version of the Datadog Exporter for OpenTelemetry collectors, so this is just a trial use.
OpenTelemetry collector Datadog exporter (Datadog document)
https://docs.datadoghq.com/tracing/setup_overview/open_standards/otel_collector_datadog_exporter
Datadog Exporter (Github)
https://github.com/open-telemetry/opentelemetry-collector-contrib/tree/main/exporter/datadogexporter
The changes are as follows: Add the Datadog configuration to the Collector configuration file.
Add Datadog settings to exporters. Replace <API_KEY> with your API Key respectively. You can also set the env tag and other tags here. Now it is time to add datadog to trace and metrics in pipelines to be sent.
The following configuration will continue to be sent to Prometheus and Jeager.
[src/otelcollector/otelcol-config.yml]

...
 exporters:
   jaeger:
     endpoint: "jaeger:14250"
     tls:
       insecure: true
   logging:
   prometheus:
     endpoint: "otelcol:9464"
+  datadog:
+    api:
+      key: <API_KEY>
+    host_metadata:
+      tags:
+        - otel:true

 processors:
   batch:
+  resource:
+    attributes:
+    - key: deployment.environment  # Set env tag for Datadog
+      value: "otel"
+      action: upsert

 service:
   pipelines:
     traces:
       receivers: [otlp]
-      processors: [batch]
+      processors: [batch, resource]
-      exporters: [logging, jaeger]
+      exporters: [logging, jaeger, datadog]
     metrics:
       receivers: [otlp]
-      processors: [batch]
+      processors: [batch, resource]
-      exporters: [prometheus, logging]
+      exporters: [prometheus, logging, datadog]
Also, the Datadog Exporter is not included in the container image in the original docker-compose.yaml, so change the image to include the contrib.
[./docker-compose.yaml]

  # Collector
  otelcol:
-   image: otel/opentelemetry-collector:0.56.0
+   image: otel/opentelemetry-collector-contrib:0.56.0
command: [ "--config=/etc/otelcol-config.yml" ]I docker compose up again, accessed the EC site, and the traces and metrics showed up in Datadog as well!
I was really impressed with how simple and easy it was.
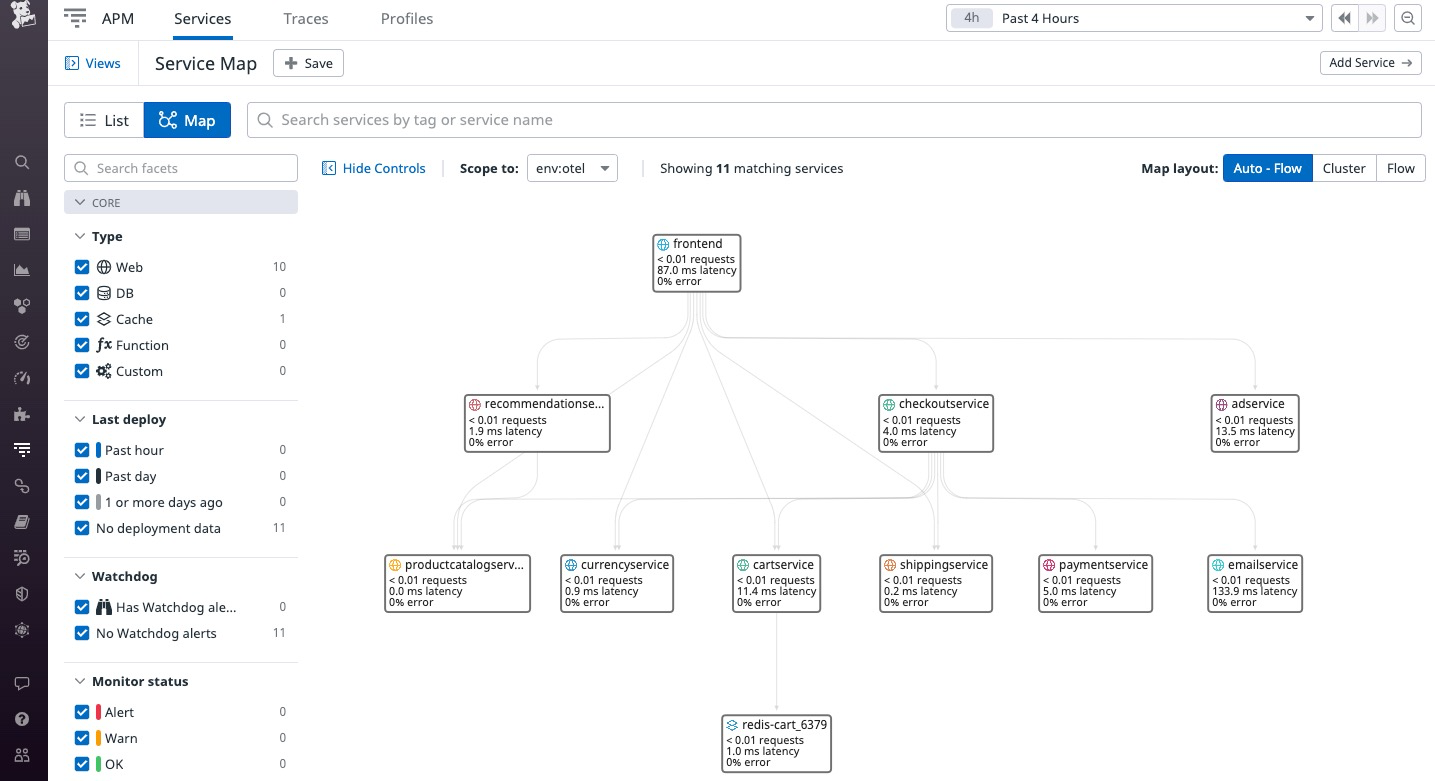
Service map: I can see the call relationships between microservices and the traffic flow!
Trace: In the individual traces, you can see the backend invocation relationships, the time taken, and other detailed information!

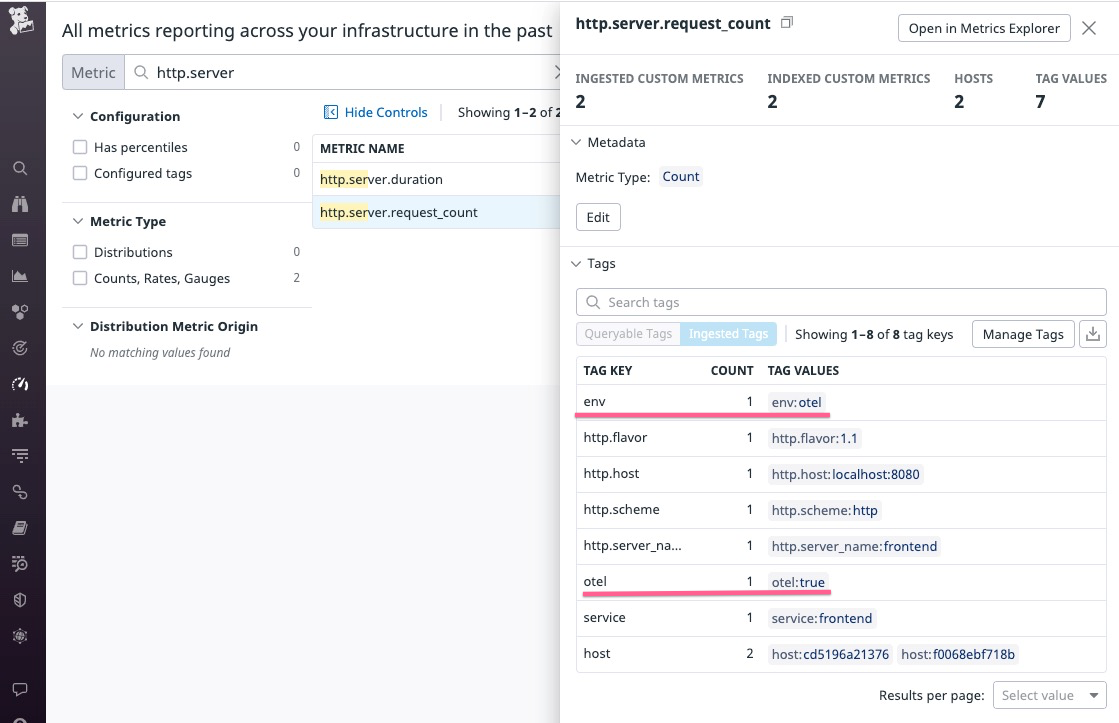
Metrics: Metrics are also sent and tagged!
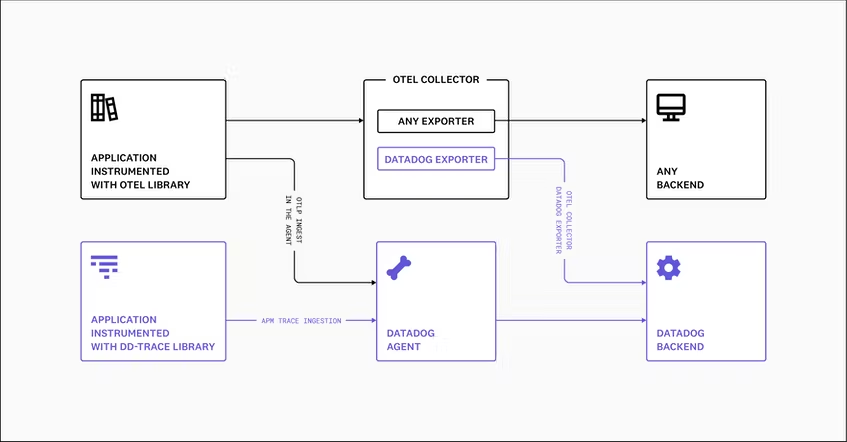
In this demonstration environment, metrics and traces are received by OpenTelemetry Collector and sent to Datadog, but Datadog Agent can be used instead. If you are already running Datadog Agent, you can use it as is. (However, the Agent must be the latest version.) As shown in the figure below, there are several ways to combine Datadog Agent with OpenTelemetry. Please refer to Datadog's blog post for details.
Ingest OpenTelemetry traces and metrics with the Datadog Agent https://www.datadoghq.com/blog/ingest-opentelemetry-traces-metrics-with-datadog-agent/