Connecting data with visuals is a core concept of D3 that leaves many confused. In this tutorial I will demystify the process and show you how easy it is to get going with a data backed visualization. With a solid grasp of Javascript, you should be able to follow along and get started on your own D3 projects as well! For curious minds, I will be using this method chain to explain how D3 works.
 d3.selectAll(someExistingElement)
   .data(someData)
   .enter()
   .append(someNonExistentElement)
Just a side note, I'll be making a lot of references to Rick and Morty in this post, and particularly to meseeks, so if you don't know what they are or what I'm on about watch this video to get up to speed.
Data visualization is the translation of quantitative data to visual/graphical representation. D3 excels in displaying more pictographic visualizations rather than just simple graphs. To better illustrate my point, let's look at an example. Let's try to create a visual showing the number of meseeks required to complete a task (more difficult tasks require more Meseeks).
[[[pen slug-hash='oxQMaZ' height='150' embed-version='2']]]
As you can see from the codepen example above, the first task of difficulty 3, requires 3 meseeks while the task of difficulty 9 requires 9 meseeks. Now let's dive in further and see how d3 is displaying our visualization.
d3__.selectAll()__
D3 gives us the ability to declaratively select elements using the select and selectAll methods. Both methods take in a css selector while 'select' only returns the first matched selector and 'selectAll' returns all matched selectors (in DOM traversal order). On the surface, this seems very similar to how elements are selected in jQuery. One key difference is that the returned selection in D3 returns a subclass— an object composed of both an array of elements and methods to enact on the whole array. This allows us to perform further operations on the selection to manipulate it. For instance, if I wanted to select all Meseeks on the page and give each individual meseek on the page a background of red, I can easily do that by chaining a method onto selectAll():
d3.selectAll('.meSeeks').style('background-color', 'red')
[[[pen slug-hash='zqMKQR' height='150' embed-version='2']]]
You can easily swap out 'style' for other methods calls. Other modifier operations can be found in the D3 docs.
d3.selectAll().data()
Now that we have made our selection, we can bring on the data. The simplest representation of data in D3 is an array of values. In this case, let's have our dataset be an array of specific tasks for our meseeks to complete——what's the use of a meseek without a task to complete?
var tasks = ['Master golf', 'Open stupid mayo jar', 'Win at poker', 'Be popular']
In D3, we bind data to our selection by using the data() operator.
var meSeeks = d3.selectAll('.meseeks')
meSeeks.data(tasks)
When we call the data bind operator, there is no visual indicator of success. But if we open up the console, and toggle through the array elements, we see that there is a __data__ attribute at the top of each element containing the data we just bound to the element. Ooooh Yeah! Our meseeks now have tasks to complete!)

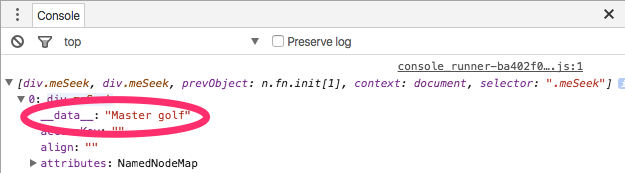
Wait a second....! Why are only the first 2 tasks assigned and not the last two?!! Good question. Currently, we have too few meseeks and too many tasks. We need to create more meseeks to complete our list of tasks. Thankfully, D3 is very flexible and allows us to work with incomplete datasets.
Ordinarily when assigning values or data attributes to elements on a page, we have to explicitly tell the browser the exact correlation between data point to selector. We do this in the form of an actual assignment like so $(specificThing).data('val', 30) or via a for loop. In D3, however, data elements are automagically joined to DOM elements when the data() operator is invoked on a selection; this concept is called a data join. The visual below illustrates this process.

By default, data is bound sequentially. This means the bind method attaches the first datum with the first element, the second datum with the second element and so on. Joining data by index is convenient but often, data is not in sequential order. This calls for additional clarification to tell D3 how data should be matched to a selection. We can do this by passing in a second argument to data called a key function.
Key Function: A key function key([ d [, i ]]) may be used to control the order data is joined to elements (this replaces the default by-index behavior). The key function returns a string for each datum which is used to evaluate the order of the data, rather than the array index.
Oookay. Let's break it down. If our dataset is an object, we have to specify which key in the object we are trying to bind to the selector.
var meseeks = {
  {"owner": "Jerry", "task": "Master golf"},
  {"owner": "Summer", "task": "Be more popular"},
  {"owner": "Beth", "task": "Be a better woman"}
}

function key(d) {
  return d.owner
}

d3.selectAll('.meSeeks').data(meSeeks, key)
That's cool, but what about that bit about mismatched DOM elements and data? Well, glad you asked, we're just getting to that.
There are 3 possible outcomes to keep in mind when joining data to elements in D3; enter, exit and update. For the scope of this tutorial, we will only be covering enter and update.
Update - There was a matching element for a given datum. (Success)
Enter - There was no matching element for a given datum. (Failure)

Update is the default behavior of how D3 connects DOM nodes with data points. Let's look back at our previous example where we had 4 items in our task list and only 2 meseeks on the page. When we invoke selection.data(), D3 matches our selection with the data passed in via an update() operator. If there is excess data, D3 sets it aside until it is told what to do with it.
Updates are a key feature in D3, because it allows visuals to be updated in real time as data changes. Let's take a look at an example where we add items to the list of tasks. Meseeks are summoned using a special device called a meseeks box. When the button on the meseeks box is pressed, a new task gets pushed to the existing task list. The role of update therefore is to notify the view that data has changed and thereby re-render it.
var tasks = ['Master golf', 'Open stupid mayo jar', 'Win at poker', 'Be popular']

function update() {
  d3.selectAll('.meseeks').data(tasks)
}

d3.selectAll('.meseekBox').on('click', function(){
  tasks.push('Master golf');
  update(); //<--- We have to re-render the view on updating the data
})
Remember that problem we had earlier about too many datum and too few DOM elements? That problem is taken care of by the enter method. Enter is a hypothetical waiting room where data is stored before assignment. To use our meseeks example, enter is like a magical ether where meseeks wait before getting assigned to tasks. We can access this ether via the enter() method.
var tasks = ['Master golf', 'Open stupid mayo jar', 'Win at poker', 'Be popular']

d3.selectAll('.meseeks').data(tasks).enter()
If you tried running that code snippet, you would quickly realize that nothing displays on the screen. This is because the enter selection simply returns placeholder nodes for the excess data. Since we haven't told D3 what to do with that data yet, nothing is displayed in the view. In order to visualize the data entered, .enter operator must be used with an .append or .insert method. This simply tells D3 to sequentially assign the surplus data ( or "enter selection") to DOM elements (like div or span) and then insert them into parent elements; In this case, because our html is empty, the parent element is assumed to be the entire html page and the span we created will be appended to the end of body. To control where the visual is appended to, create an empty div with a class name attached to it, which you can then pass into d3.selectAll([className])
var tasks = ['Master golf', 'Open stupid mayo jar', 'Win at poker', 'Be popular']

function update() {
  d3.selectAll('.meseeks').data(tasks)
     .enter().append('span') //<------ *** Note this line ***
}

d3.selectAll('.meseekBox').on('click', function(){
  tasks.push('Master golf');
  update();
})
I put together an example pen that wraps up the concepts we covered in this tutorial and also incorporates the exit method that I mentioned in passing. You can find that pen here. Pressing the meseek box button will enter meseeks onto the page and clicking on the meseek will remove(exit) them from the page. The D3 website also has many more awesome tutorials and visualization example that you can look through for inspiration in creating your own visualizations.
Thanks for reading and happy visualizing! "Wubba lubba dub-dub!"