These are instructions on how to use Elastic Observability with Remix.
The easiest way to get a working cluster is with Elastic Cloud. Create a new deployment. Once it's ready you'll want to copy the APM endpoint URL:

In your Remix app, install the Elastic RUM JavaScript agent:
npm install @elastic/apm-rum --saveAdd the following to app/entry.client.tsx:
import { hydrate } from "react-dom";
import { RemixBrowser } from "remix";
import { init as initApm } from "@elastic/apm-rum";
initApm({
// Set required service name (allowed characters: a-z, A-Z, 0-9, -, _, and space)
serviceName: "remix-example-client",
// Set custom APM Server URL (default: http://localhost:8200)
serverUrl: "https://my-elastic-apm-url",
// Set service version (required for sourcemap feature)
serviceVersion: "0.1.0",
});
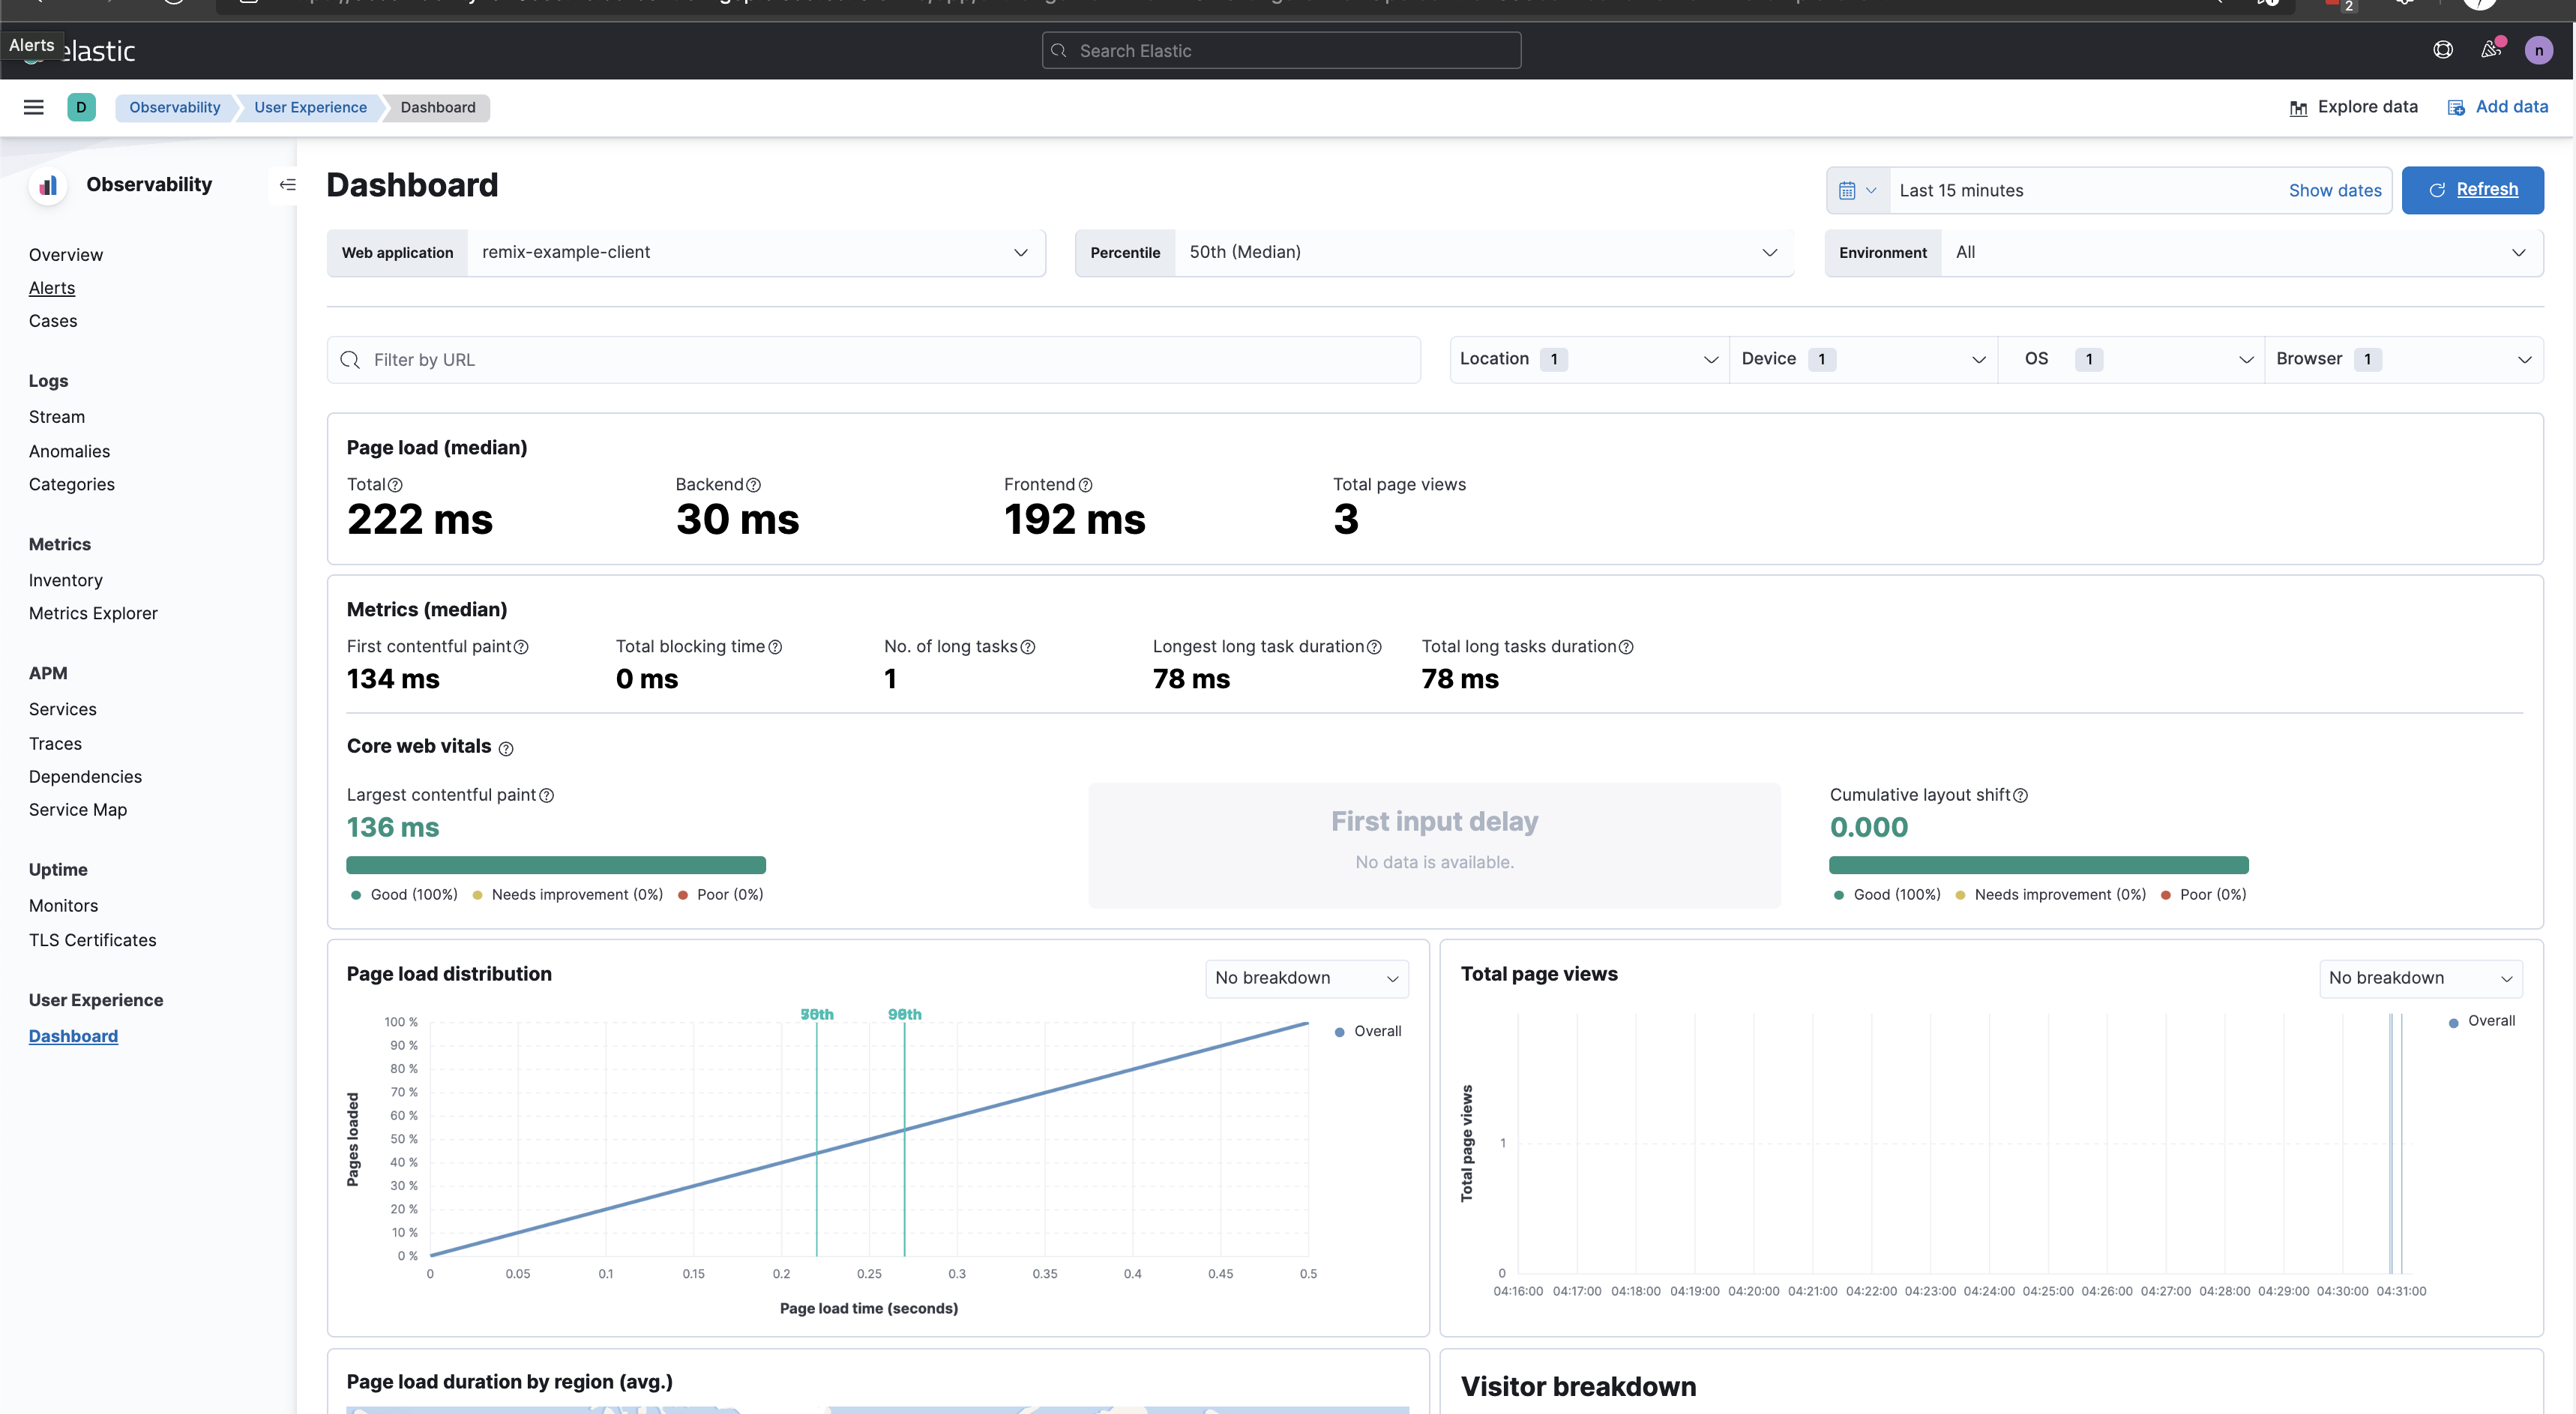
hydrate(<RemixBrowser />, document);Now you can browse around your APP on localhost, then go back to your Elastic deployment and click "Open Kibana" to go to Kibana. Go to Observability > User Experience on the top-level hamburger menu. You'll see data from your app:
If you go to Observability > APM you'll see your app on the list of services. Clicking on it will go to the service overview:
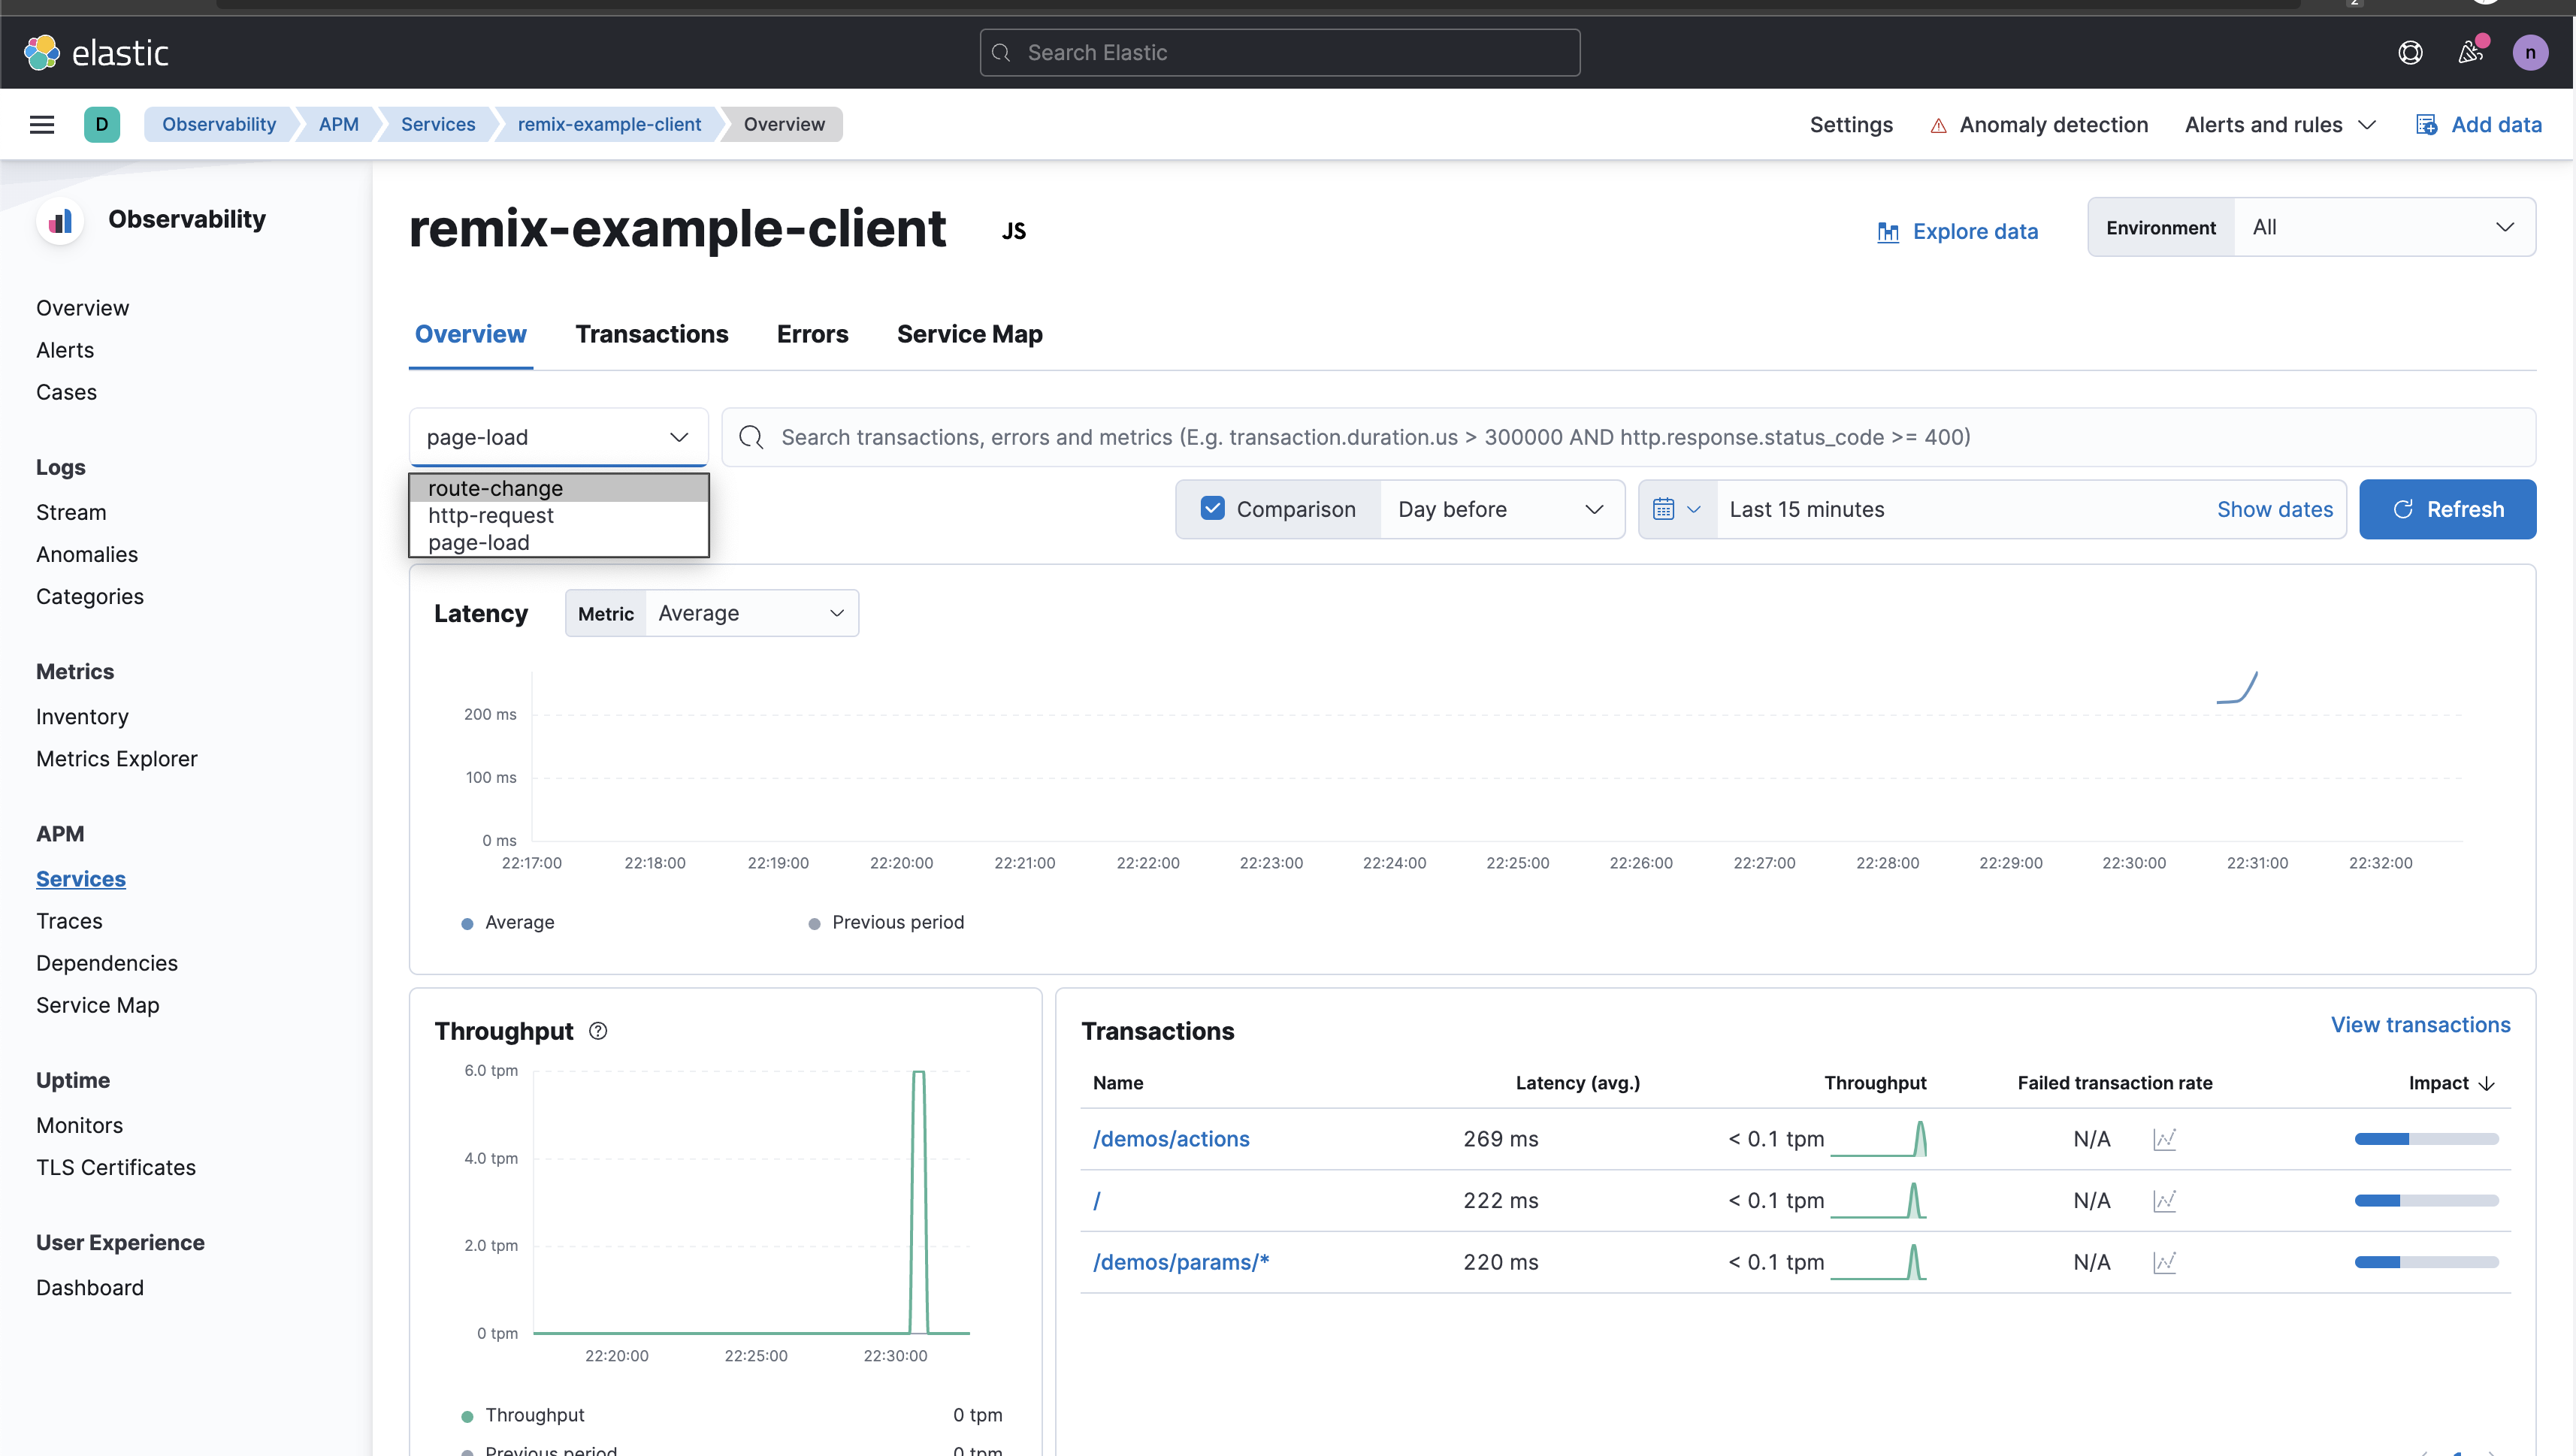
Here you can see the transactions, and swith between route-change, page-load, or http-request event types. You can click into a transaction to see more data about it, including a trace waterfall.
This setup works pretty well out of the box, but we might need to make some improvements to get the transaction names to show up how you would expect.
This is only client-side monitoring, so we're not looking at any of the server-side transactions directly.
Hopefully this was helpful, and we can improve Elastic's support for Remix and the platforms it runs on.