Last active
September 19, 2022 17:19
-
-
Save soh-i/daef293389e978edd412487e307c6c0d to your computer and use it in GitHub Desktop.
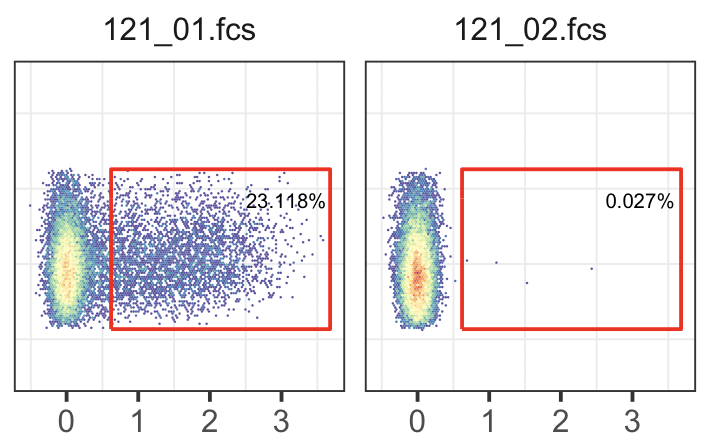
FACS plot with user-defined gate
This file contains bidirectional Unicode text that may be interpreted or compiled differently than what appears below. To review, open the file in an editor that reveals hidden Unicode characters.
Learn more about bidirectional Unicode characters
| library(CytoML) | |
| library(flowWorkspace) | |
| library(ggcyto) | |
| xmlfile <- 'gate.xml' # Gating-ML xml file generated by Cytobank | |
| fcsFiles <- list.files(pattern='.fcs', path='./FCS/', full.names=TRUE) | |
| gs <- cytobank2GatingSet(xmlfile, fcsFiles) | |
| fs <- getData(gs, "P1") # FCS file object filtered by P1 gate (live cell) | |
| P2 <- getGate(gs, "P2") # P2 gate object (EGFP gate) | |
| g <- ggcyto(fs, aes(y=`FSC-A`, x=`FITC-A`)) + | |
| facet_wrap(~name) + | |
| geom_hex(bins=128) + | |
| geom_gate(P2) + | |
| geom_stats(fill='transparent', digits=1.0, size=2, adjust=0.8) + | |
| theme_bw() + | |
| theme( | |
| strip.background=element_rect(colour=NA, fill=NA), | |
| panel.grid.major=element_blank(), aspect.ratio=1) + | |
| labs(x='EGFP intensity', y='FSC-A') + | |
| scale_y_continuous(limits=c(0, 200000)) |
Author
soh-i
commented
Oct 29, 2018
Sign up for free
to join this conversation on GitHub.
Already have an account?
Sign in to comment