Skip to content

Instantly share code, notes, and snippets.

@sonots
Last active April 24, 2024 13:54
Show Gist options
  • Save sonots/5abc0bccec2010ac69ff74788b265086 to your computer and use it in GitHub Desktop.
Save sonots/5abc0bccec2010ac69ff74788b265086 to your computer and use it in GitHub Desktop.
How to use NVIDIA profiler

Usually, located at /usr/local/cuda/bin

Non-Visual Profiler

$ nvprof python train_mnist.py

I prefer to use --print-gpu-trace.

$ nvprof --print-gpu-trace python train_mnist.py

Visual Profiler

On GPU machine, run

$ nvprof -o prof.nvvp python train_mnist.py

Copy prof.nvvp into your local machine

$ scp your_gpu_machine:/path/to/prof.nvvp .

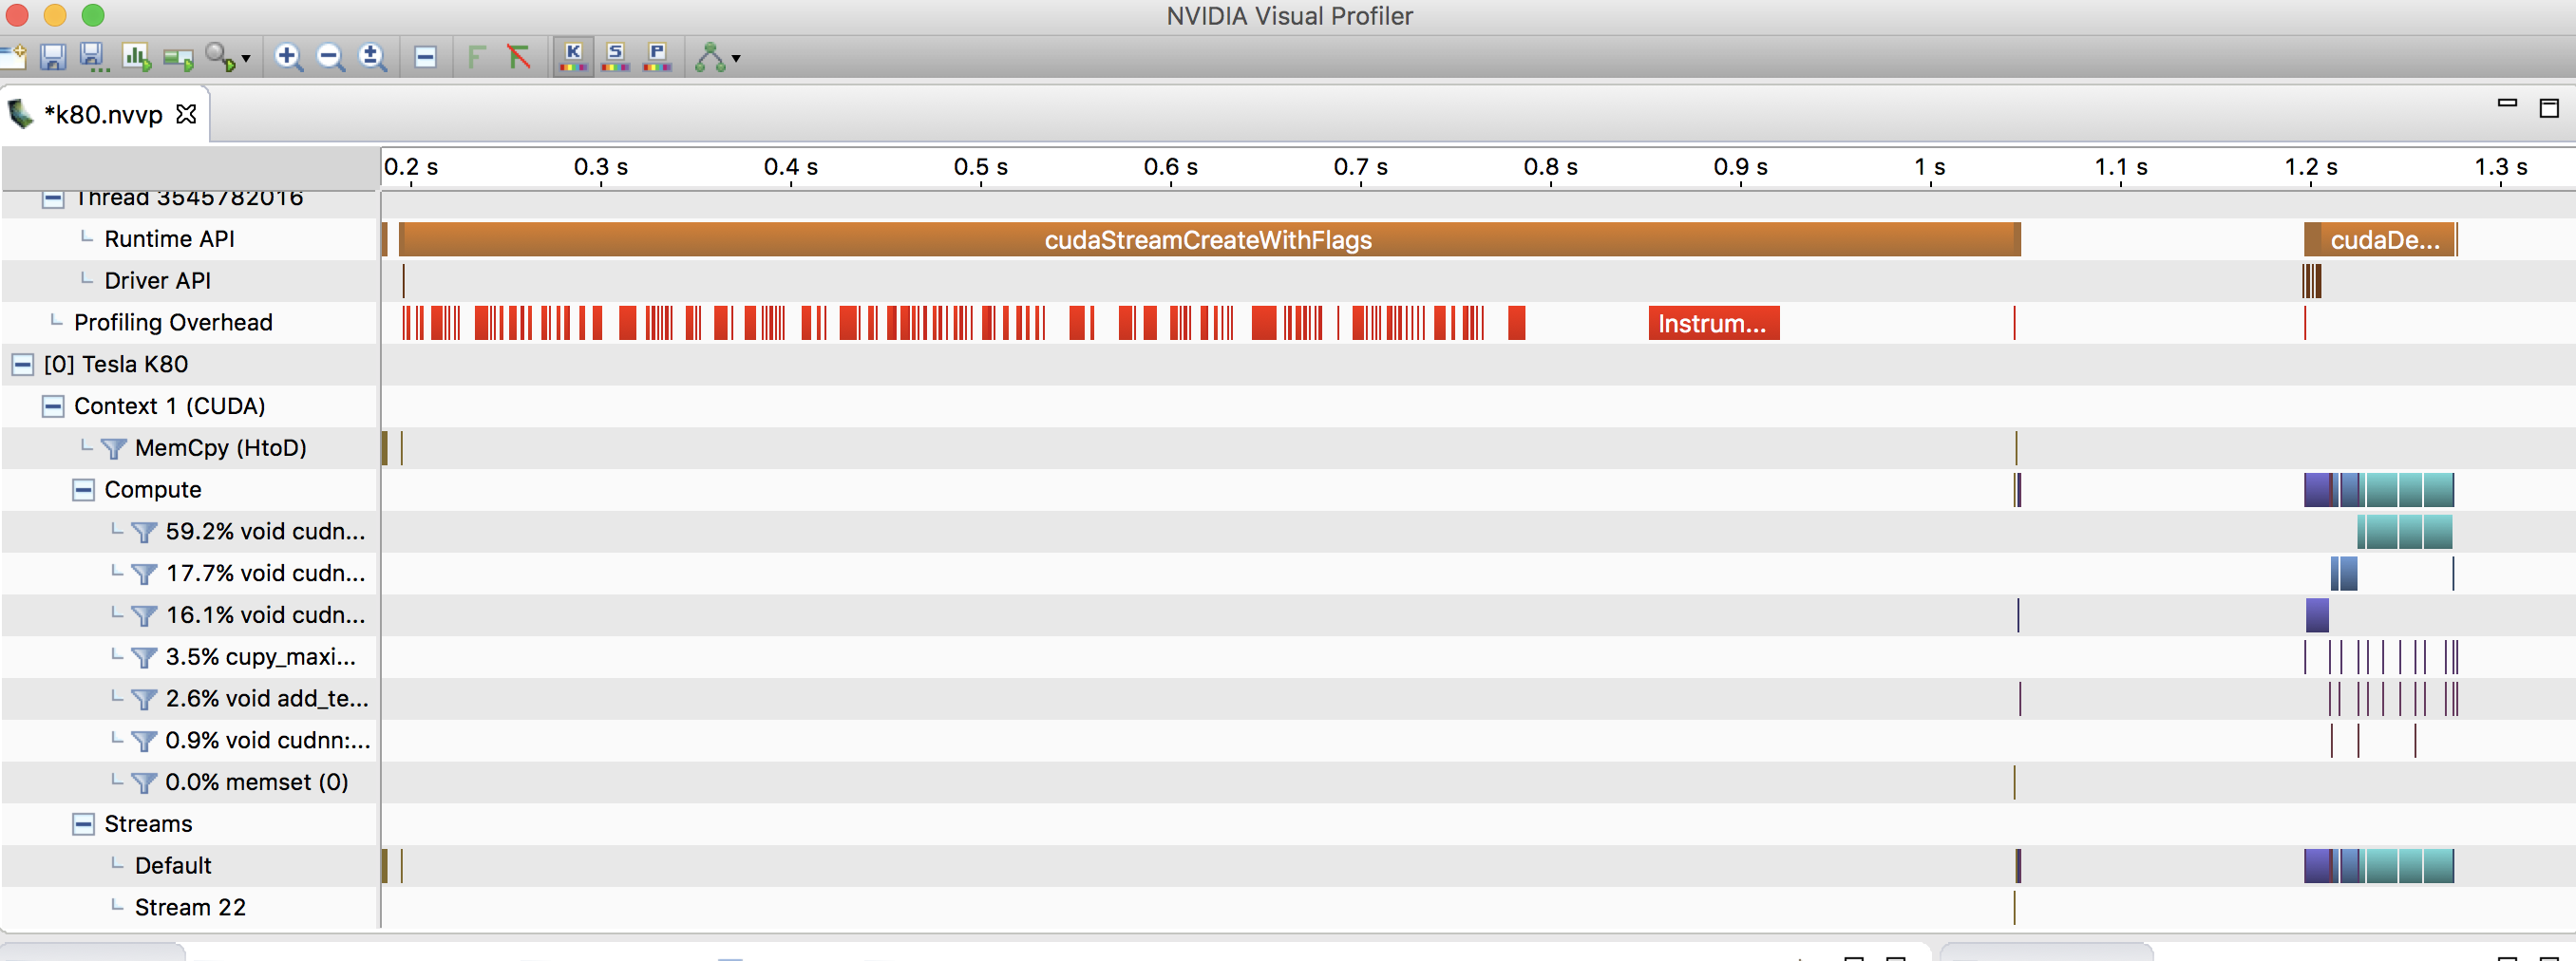
Then, run nvvp (nvidia visual profiler) on your local machine:

$ nvvp prof.nvvp

It works more comfortably than X11 forwarding or something.

@sonots
Copy link
Author

sonots commented Oct 19, 2017

An example of nvprof --print-gpu-trace result:

$ nvprof --print-gpu-trace python examples/stream/cusolver.py
==28079== NVPROF is profiling process 28079, command: python examples/stream/cusolver.py
==28079== Profiling application: python examples/stream/cusolver.py
==28079== Profiling result:
   Start  Duration            Grid Size      Block Size     Regs*    SSMem*    DSMem*      Size  Throughput           Device   Context    Stream  Name
652.12ms  1.5360us                    -               -         -         -         -       72B  44.703MB/s  GeForce GTX TIT         1         7  [CUDA memcpy HtoD]
885.35ms  3.5520us              (1 1 1)         (9 1 1)        35        0B        0B         -           -  GeForce GTX TIT         1        13  cupy_copy [412]
1.17031s  1.2160us                    -               -         -         -         -      112B  87.838MB/s  GeForce GTX TIT         1         7  [CUDA memcpy HtoD]
1.17104s  1.2800us                    -               -         -         -         -        4B  2.9802MB/s  GeForce GTX TIT         1        13  [CUDA memcpy HtoD]
1.17117s  2.2400us                    -               -         -         -         -       72B  30.654MB/s  GeForce GTX TIT         1        13  [CUDA memcpy DtoH]
1.17119s     864ns                    -               -         -         -         -        4B  4.4152MB/s  GeForce GTX TIT         1        13  [CUDA memcpy HtoD]
1.17123s  1.3760us              (1 1 1)       (256 1 1)         8        0B        0B         -           -  GeForce GTX TIT         1        13  void reset_diagonal_real<double, int=8>(int, double*, i
nt) [840]
1.17125s     768ns                    -               -         -         -         -       16B  19.868MB/s  GeForce GTX TIT         1        13  [CUDA memset]
1.17127s  32.928us              (1 1 1)       (128 1 1)        30  1.0000KB        0B         -           -  GeForce GTX TIT         1        13  void nrm2_kernel<double, double, double, int=0, int=0,
int=128, int=0>(cublasNrm2Params<double, double>) [848]
1.17130s  30.016us              (1 1 1)       (128 1 1)        30  1.0000KB        0B         -           -  GeForce GTX TIT         1        13  void nrm2_kernel<double, double, double, int=0, int=0,
int=128, int=0>(cublasNrm2Params<double, double>) [853]
1.17134s  2.0160us                    -               -         -         -         -        8B  3.7844MB/s  GeForce GTX TIT         1        13  [CUDA memcpy DtoH]
1.17135s  1.7920us                    -               -         -         -         -        8B  4.2575MB/s  GeForce GTX TIT         1        13  [CUDA memcpy DtoH]
1.17137s  1.8560us              (1 1 1)       (384 1 1)        10        0B        0B         -           -  GeForce GTX TIT         1        13  void scal_kernel_val<double, double, int=0>(cublasScalP
aramsVal<double, double>) [863]
1.17138s     832ns                    -               -         -         -         -        8B  9.1699MB/s  GeForce GTX TIT         1        13  [CUDA memcpy HtoD]
1.17138s     864ns                    -               -         -         -         -        8B  8.8303MB/s  GeForce GTX TIT         1        13  [CUDA memcpy HtoD]
1.17139s  1.8240us                    -               -         -         -         -        8B  4.1828MB/s  GeForce GTX TIT         1        13  [CUDA memcpy DtoH]
1.17140s  1.8880us                    -               -         -         -         -        8B  4.0410MB/s  GeForce GTX TIT         1        13  [CUDA memcpy DtoH]
1.17141s     864ns                    -               -         -         -         -        8B  8.8303MB/s  GeForce GTX TIT         1        13  [CUDA memcpy HtoD]
1.17142s     832ns                    -               -         -         -         -        8B  9.1699MB/s  GeForce GTX TIT         1        13  [CUDA memcpy HtoD]
1.17143s  5.6320us             (64 1 1)       (128 1 1)        48  5.5000KB        0B         -           -  GeForce GTX TIT         1        13  void syhemv_kernel<double, int=64, int=128, int=4, int=
5, bool=1, bool=0>(cublasSyhemvParams<double>) [875]
1.17145s  3.9360us              (1 1 1)       (128 1 1)        14  1.0000KB        0B         -           -  GeForce GTX TIT         1        13  void dot_kernel<double, double, double, int=128, int=0,
 int=0>(cublasDotParams<double, double>) [882]
1.17146s  3.0400us              (1 1 1)       (128 1 1)        16  1.5000KB        0B         -           -  GeForce GTX TIT         1        13  void reduce_1Block_kernel<double, double, double, int=1
28, int=7>(double*, int, double*) [888]

[omitted]

@sonots
Copy link
Author

sonots commented Oct 19, 2017

An example of nvvp result:

image

image

@shizukanaskytree
Copy link

Thank you for your post!

@rohith14
Copy link

rohith14 commented Nov 1, 2018

Hi,
I get "No kernels profiled" as seen shown below. Any idea?

$ nvprof --print-gpu-trace python train_mnist.py --network mlp --num-epochs 1
INFO:root:start with arguments Namespace(add_stn=False, batch_size=64, disp_batches=100, dtype='float32', gc_threshold=0.5, gc_type='none', gpus=None, kv_store='device', load_epoch=None, lr=0.05, lr_factor=0.1, lr_step_epochs='10', model_prefix=None, mom=0.9, monitor=0, network='mlp', num_classes=10, num_epochs=1, num_examples=60000, num_layers=None, optimizer='sgd', test_io=0, top_k=0, wd=0.0001)
==27259== NVPROF is profiling process 27259, command: python train_mnist.py --network mlp --num-epochs 1
INFO:root:Epoch[0] Batch [100] Speed: 39195.15 samples/sec accuracy=0.779548
INFO:root:Epoch[0] Batch [200] Speed: 54730.25 samples/sec accuracy=0.915781
INFO:root:Epoch[0] Batch [300] Speed: 52417.13 samples/sec accuracy=0.923281
INFO:root:Epoch[0] Batch [400] Speed: 52111.75 samples/sec accuracy=0.935781
INFO:root:Epoch[0] Batch [500] Speed: 52394.11 samples/sec accuracy=0.946250
INFO:root:Epoch[0] Batch [600] Speed: 52185.51 samples/sec accuracy=0.947656
INFO:root:Epoch[0] Batch [700] Speed: 52354.36 samples/sec accuracy=0.953125
INFO:root:Epoch[0] Batch [800] Speed: 52180.64 samples/sec accuracy=0.958750
INFO:root:Epoch[0] Batch [900] Speed: 52312.02 samples/sec accuracy=0.953281
INFO:root:Epoch[0] Train-accuracy=0.955236
INFO:root:Epoch[0] Time cost=3.287
INFO:root:Epoch[0] Validation-accuracy=0.963774
==27259== Profiling application: python train_mnist.py --network mlp --num-epochs 1
==27259== Profiling result:
No kernels were profiled.

@Double1996
Copy link

Thank you very much!

@dorraghzela
Copy link

Hello,

Thank you for sharing this. I have a silly question actually, I want to know if the profiling time for example memcpy includes the time for the API call cudaMemcpy ??

Thank you

@jrevels
Copy link

jrevels commented Nov 1, 2019

Thanks!

To help out other MacOS users in case they run into the same problem I did:

Make sure to point nvvp to a supported version of the JRE:

/Developer/NVIDIA/CUDA-10.1/bin/nvvp -vm /Library/Java/JavaVirtualMachines/jdk1.8.0_151.jdk/Contents/Home/jre/bin/java

Also make sure that the argument to -vm is an absolute path; it doesn't seem to understand relative paths.

@boydad
Copy link

boydad commented Nov 13, 2019

@jrevels, Thank you!

There are also problems with the installation of the Cuda toolkit on Catalina. It can be solved by adding a link /Developer to any place. To do it on Catalina you need to add a line
Developer /Users/userName
to file /etc/synthetic.conf : like it is written here.

@sumit-byte
Copy link

Hello, iam having problem on viewing the visual profiler. Every time it open upon selecting a file it returns a error, saying "The application being profilled returned a non-zero code"

@HenryYihengXu
Copy link

Hello, do you know how to see GPU utilization with nvvp? I only see the duration of a function. But I want to also see the percentage of GPU utilization during a function.

@keke8273
Copy link

keke8273 commented Mar 4, 2020

i have to use the --profile-child-processes option to get the profile to work on windows.

@hudannag
Copy link

I get no outputs using nvprof. No matter if I give arguments or not.
Doesn't work with .exe file build with VS2019, nor using nvprof python program.py.

Can you please help?

@hitvoice
Copy link

On Mac, nvvp prof.nvvp doesn't work.
An absolute path (instead of a relative path like "prof.nvvp") has to be provided.

@danpovey
Copy link

My recommendation to anyone who wants to install nvvp on an up-to-date Mac (catalina) is not to even try.
Firstly you have to disable gatekeeper:
sudo spctl --master-disable
but then after you download nvvp it won't run because it wants an outdated java runtime (JRE) that's hard to get or install.
I still haven't figured it out.
Currently I'm trying to figure out how to do this, but it looks like it's very very painful.

@1chimaruGin
Copy link

Thanks man! Great help

@ccjjs
Copy link

ccjjs commented Jun 12, 2021

PDD XBJ GOD, YYDS

Sign up for free to join this conversation on GitHub. Already have an account? Sign in to comment