##esprima etc
- use esprima to parse our codebase, then in the AST (abstract syntax tree that represents the code) that esprima outputs, alter the tree by inserting new functions to trace and time function calls and other things we can measure, then recompile the AST back into javascript and run that code as a sort of dev/debug bundle
- i think a good first step might be to take an inventory of the available tools to profile single page apps and see if there is something out there that can help us so we don't have to do it all from scratch
- if there is something out there that would work for us, maybe the esprima route might be more trouble than it is worth, but i just don't know what sort of things are out there yet
Instrument the modules to get metrics about what to optimize (1-3 days) how to measure how long it takes for something to be served, rendered in dom
##what we're measuring how long does it take...
- to get content from the api
- we could look at Production Dev API..?
- for something to be rendered
- to serve the bootstrap page from node (that initial html page, before script is fetched)
req.allLoaded = req.backendLoaded + req.frontendLoaded;
- for certain interactions to take place
- log google analytics, mixpanel (?)
- do we want to add the html async script tag? render/paint as response comes.
and also...
- what code is dead/not being used?
- which views are called the most?
- mixpanel
- have everything inherit from BaseView, make a
postInitiliaztionfunc that sends msg to mixpanel saying 'hey i was rendered'
- what can we get from new relic?
- is backbone faster/slower than react?
##how can we automate?
- tests
- script that loads the app and creates a report
##profilers
##research
- benchmarkjs
- node's
console- manually (or with esprima?) log the time something took
- google analytics
- track timing can track timing of events
- user timing
- a place to track it, but doesn't track time events for you; manual for each function
- firebug
- profiling, done in the console
- web page performance test one-off
- chrome
-
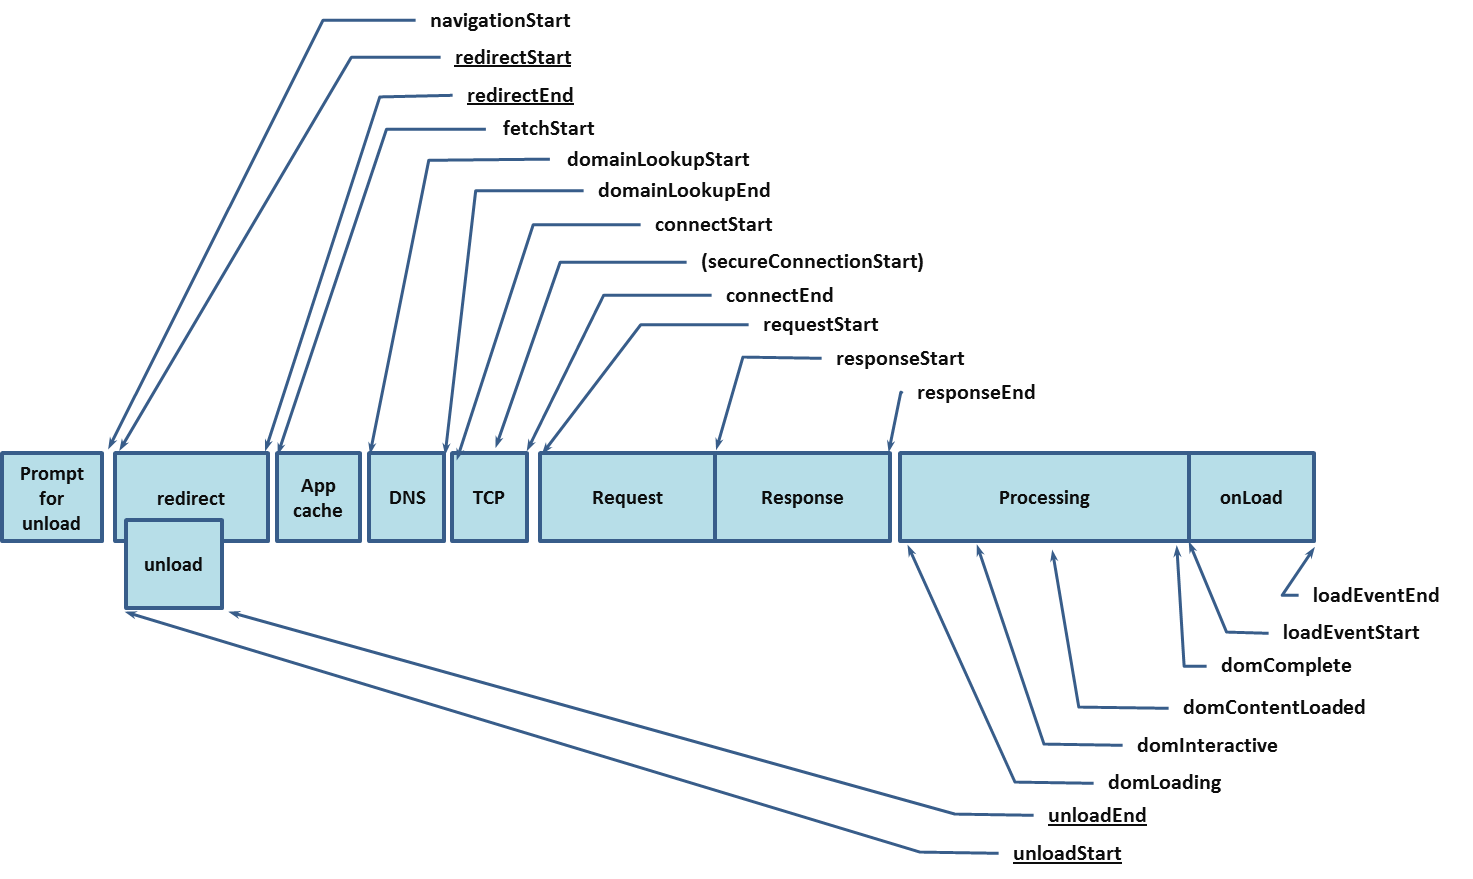
navigation timing, also here for descriptions of the methods
- the load event fires at the end of the document loading process. At this point, all of the objects in the document are in the DOM, and all the images, scripts, links and sub-frames have finished loading.
function onLoad() {
  var now = new Date().getTime();
  var page_load_time = now - performance.timing.navigationStart;
  console.log("User-perceived page loading time: " + page_load_time);
}
performance.timing.responseEnd - performance.timing.requestStart- time b/t the request being made and the response being returned
performance.timing.domComplete - performance.timing.requestStart- time b/t request and dom completion
-
window user timing api
- e.g. you can mark events and then measure it
window.performance.mark('mark_fully_loaded'); - could use it to mark how long it takes for an api call
- would have to be manaul (or esprima?)
- e.g. you can mark events and then measure it
- new relic
- measures the overall time to load the entire webpage
- uses navigation timing (above) where available. if not uses a NREUM cookie to collect timing info
- overview of what takes a long time in the browser (newrelic browser) but doesn't go into specific function calls
- nodetime
require('nodetime').profile({ accountKey: 'ce7d557e1717ec8e7c78dd3b0dfdf500f580266e', appName: 'Node.js Application' });- link for v
- will do the same thing that newrelic does
- acquired by app dynamics so not super well-kept
- they offer app performance (costs $$)