Created
July 6, 2019 19:25
-
-
Save statwonk/34fc4314c80a7c6a86394ac4e997d64d to your computer and use it in GitHub Desktop.
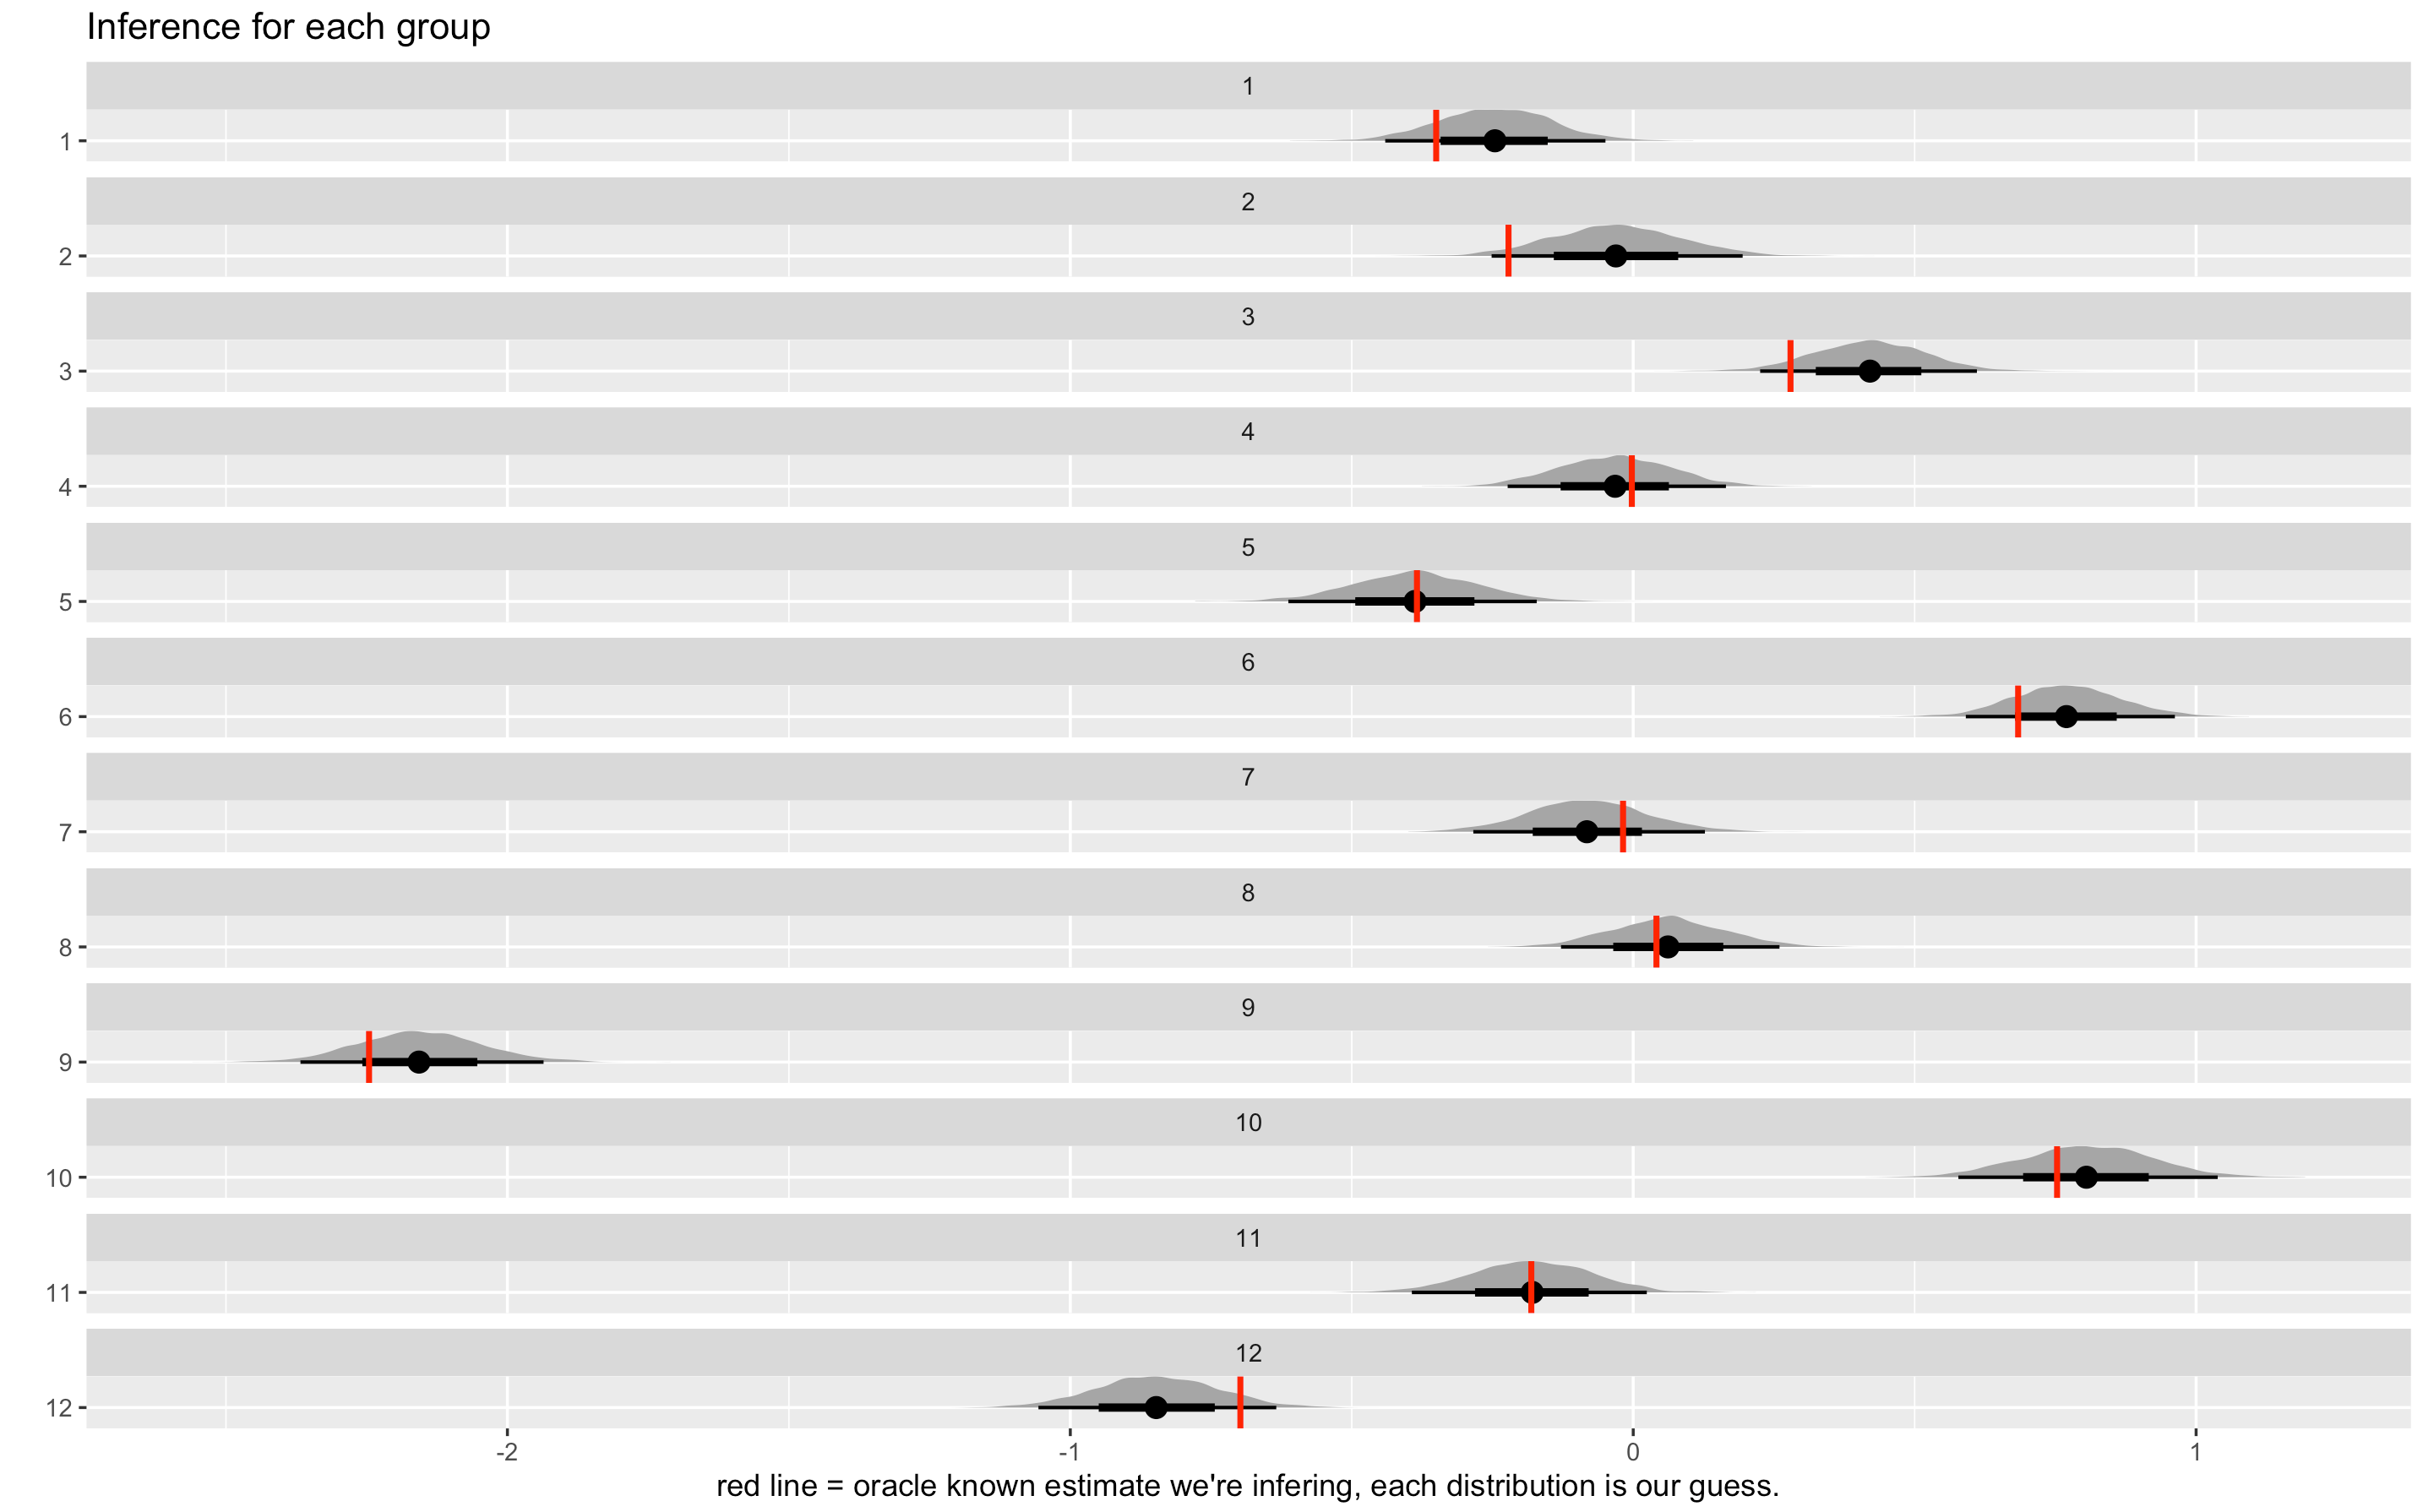
A minimal Bayesian multi-level model. 12 groups.
This file contains bidirectional Unicode text that may be interpreted or compiled differently than what appears below. To review, open the file in an editor that reveals hidden Unicode characters.
Learn more about bidirectional Unicode characters
| library(brms) | |
| library(tidybayes) | |
| N <- 1e3 | |
| number_of_groups <- 12 | |
| group_means <- rnorm(number_of_groups) | |
| tibble(obs = seq_len(N)) %>% | |
| mutate(group = sample(seq_len(number_of_groups), n(), replace = TRUE), | |
| contribution = group_means[group], | |
| discrepancy = rnorm(n()), | |
| y = contribution + discrepancy) -> x | |
| brm(y ~ (1|group) - 1, data = x, cores = 4, control = list(adapt_delta = 0.99)) -> bfit | |
| x %>% | |
| add_fitted_draws(bfit) %>% | |
| ungroup() %>% | |
| group_by(group) %>% | |
| sample_n(1e4) %>% | |
| ggplot(aes(x = .value, y = factor(group))) + | |
| geom_halfeyeh() + | |
| geom_vline(aes(xintercept = contribution), color = "red", size = 1) + | |
| facet_wrap(~ group, ncol = 1, scales = "free_y") + | |
| ylab("") + | |
| ggtitle("Inference for each group's hidden estimate (red lines)") + | |
| xlab("red line = our hidden estimate we're trying to infer, each distribution is our guess.") |
Author
statwonk
commented
Jul 6, 2019
Sign up for free
to join this conversation on GitHub.
Already have an account?
Sign in to comment