Last active
October 2, 2023 15:58
-
-
Save stla/e93995905bb70c54c6bd49acfa9eb635 to your computer and use it in GitHub Desktop.
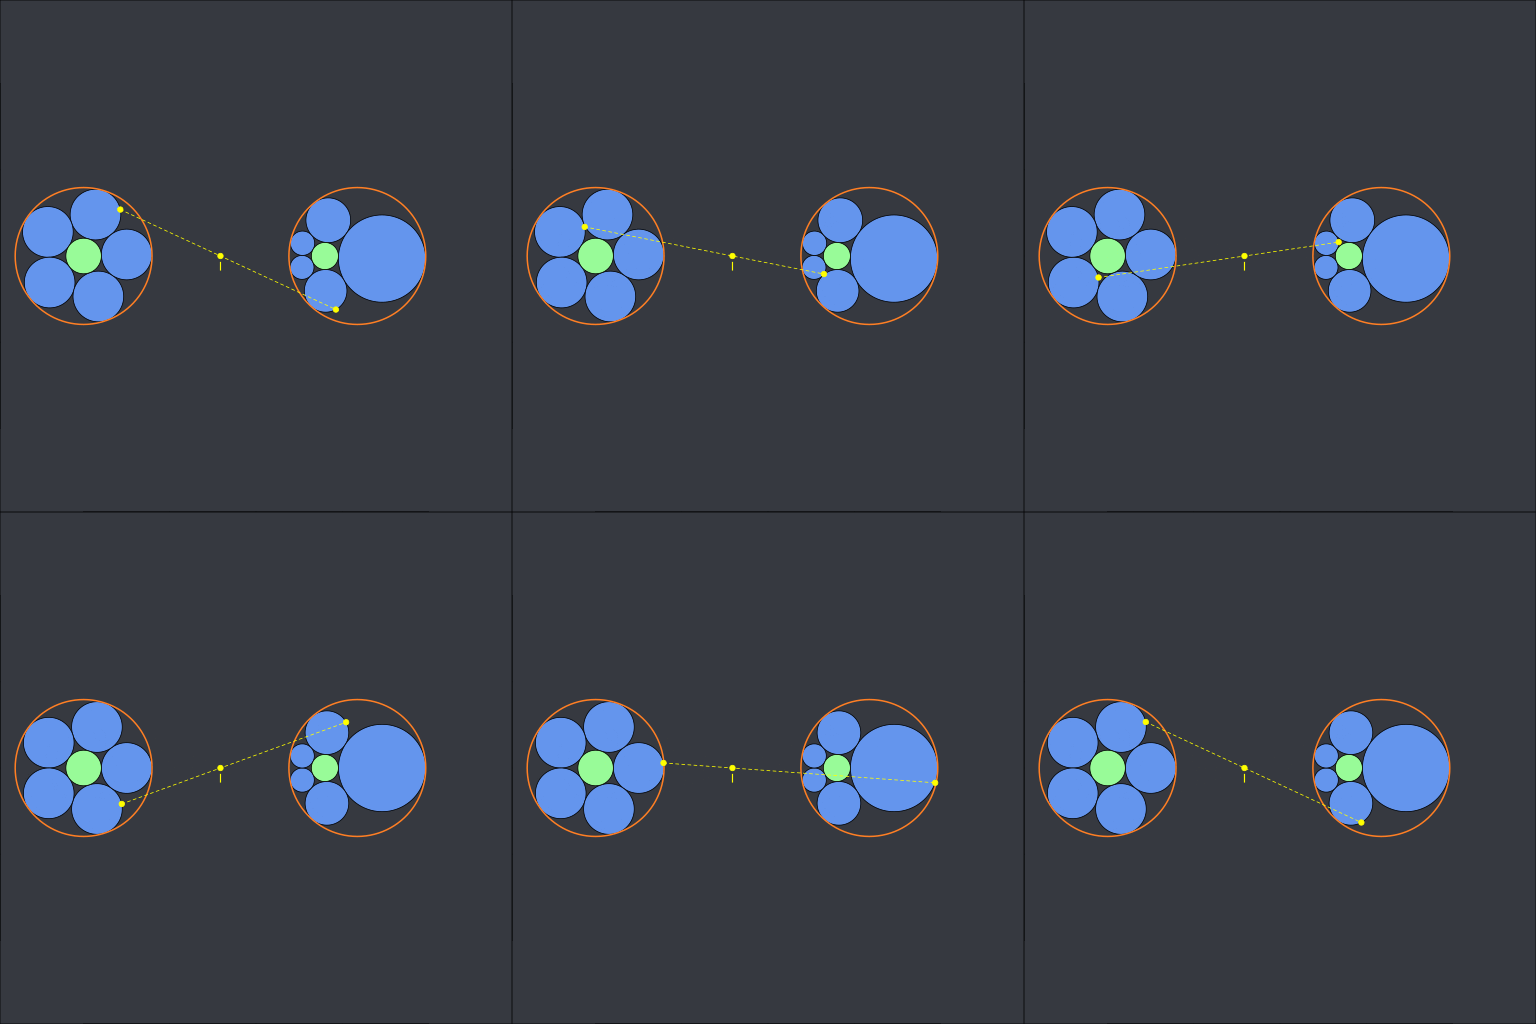
Steiner chain with R
This file contains bidirectional Unicode text that may be interpreted or compiled differently than what appears below. To review, open the file in an editor that reveals hidden Unicode characters.
Learn more about bidirectional Unicode characters
| library(plotrix) # used for the draw.circle function | |
| iota <- function(phi, R, M){ | |
| I <- c(R/phi, 0) | |
| k <- R*R * (1 - 1/phi/phi) | |
| I + k/c(crossprod(M - I)) * (M - I) | |
| } | |
| iotaCircle <- function(phi, R, center, radius){ | |
| r <- R * sqrt(1/phi/phi - 1) | |
| z1 <- (c(R/phi, 0) - center)/r | |
| D1 <- (radius/r)^2 - c(crossprod(z1)) | |
| z2 <- -z1/D1 | |
| R2 <- sqrt(c(crossprod(z2)) + 1/D1) | |
| list(center = r*z2 + c(R/phi, 0), radius = r*R2) | |
| } | |
| fplot <- function(n, angle0, phi, bg = rgb(54, 57, 64, maxColorValue = 255)){ | |
| angles <- angle0 + seq(0, 2*pi, by = 2*pi/n)[-1L] | |
| ngon <- cbind(cos(angles), sin(angles)) | |
| s <- sin(pi/n) | |
| R <- 1 + s | |
| # | |
| par(mar = c(0, 0, 0, 0), bg = bg) | |
| plot(0, 0, xlim=c(-1.5, 9.5), ylim=c(-2, 2), asp = 1, xlab = NA, ylab = NA) | |
| for(i in 1:n){ | |
| points(ngon[i, 1L], ngon[i, 2L], pch = 19L) | |
| draw.circle(ngon[i, 1L], ngon[i, 2L], s, col = "cornflowerblue") | |
| } | |
| # interior circle | |
| draw.circle(0, 0, 1 - s, col = "palegreen") | |
| # exterior circle | |
| draw.circle(0, 0, R, border = "chocolate1", lwd = 2) | |
| # images of the n blue circles | |
| for(i in 1:n){ | |
| circle <- iotaCircle(phi, R, ngon[i, ], s) | |
| draw.circle( | |
| circle$center[1L], circle$center[2L], circle$radius, | |
| col = "cornflowerblue" | |
| ) | |
| } | |
| # image of the interior circle | |
| circle <- iotaCircle(phi, R, c(0, 0), 1 - s) | |
| draw.circle( | |
| circle$center[1L], circle$center[2L], circle$radius, | |
| col = "palegreen" | |
| ) | |
| # image of the exterior circle | |
| draw.circle(2*R/phi, 0, R, border = "chocolate1", lwd = 2) | |
| # show I | |
| points(R/phi, 0, pch = 19L, col = "yellow") | |
| text(R/phi, 0, "I", pos = 1, col = "yellow") | |
| # show a point with its image | |
| M <- c(s*cos(0.2), s*sin(0.2)) + ngon[1L, ] | |
| points(M[1L], M[2L], pch = 19L, col = "yellow") | |
| Mprime <- iota(phi, R, M) | |
| points(Mprime[1L], Mprime[2L], pch = 19L, col = "yellow") | |
| segments(M[1L], M[2L], Mprime[1L], Mprime[2L], lty = 2L, col = "yellow") | |
| } | |
| fplot(n = 5, angle0 = 0.2, phi = 0.5) | |
| # animation #### | |
| angle0_ <- seq(0, 2*pi, by = pi/90)[-1L] | |
| for(i in seq_along(angle0_)) { | |
| print(i) | |
| svg("x.svg") | |
| fplot(n = 5, angle0 = angle0_[i], phi = 0.5) | |
| dev.off() | |
| rsvg::rsvg_png( | |
| "x.svg", sprintf("zzpic%03d.png", i), width = 512, height = 512 | |
| ) | |
| } | |
| library(gifski) | |
| pngs <- Sys.glob("zzpic*.png") | |
| gifski( | |
| pngs, | |
| "SteinerChain2D.gif", | |
| width = 512, height = 512, | |
| delay = 1/12 | |
| ) | |
| file.remove(pngs) |
Author
stla
commented
Oct 2, 2023

Sign up for free
to join this conversation on GitHub.
Already have an account?
Sign in to comment
