###Girl Develop It
Aurelia Moser, @auremoser, aurelia@cartodb.com
Andy Eschbacher, @MrEPhysics, eschbacher@cartodb.com
August 19th, 2015
Find this document here:
- Gist: http://tinyurl.com/gdi-webmap
- Github: https://github.com/auremoser/gdi-webmap/
- Etherpad: https://etherpad.mozilla.org/gdi-webmap
- Class Posting: http://www.meetup.com/girldevelopit/events/223963876/?
- Mapping Basics
- You are Here.
- Types + Topics
- Anatomy of a Webmap
- Mapping Data
- Formats + Free Sources
- Collecting + Sync Tables
- Storing
- Mapping Tools
- Examples
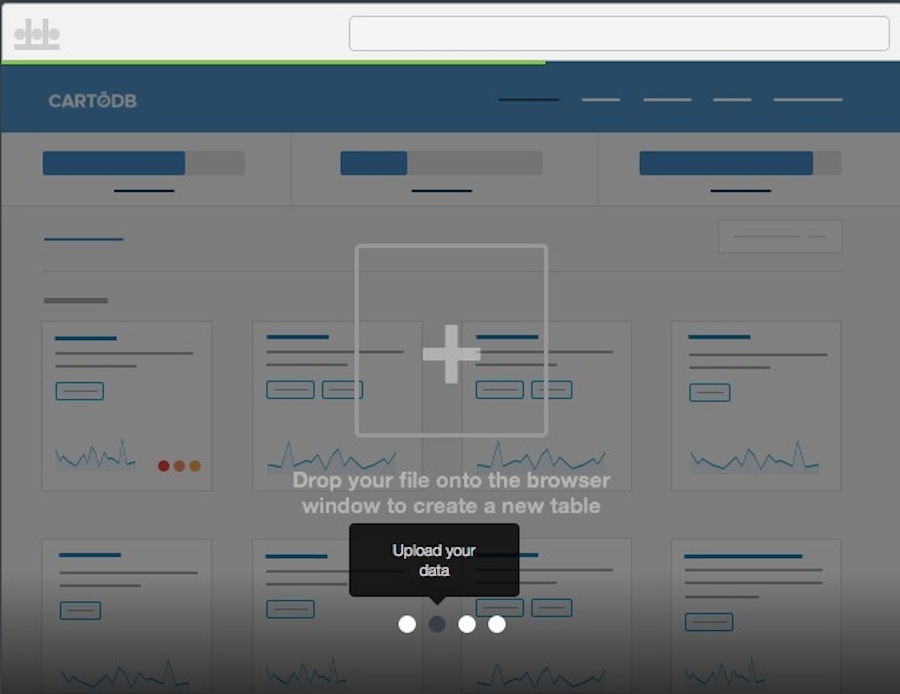
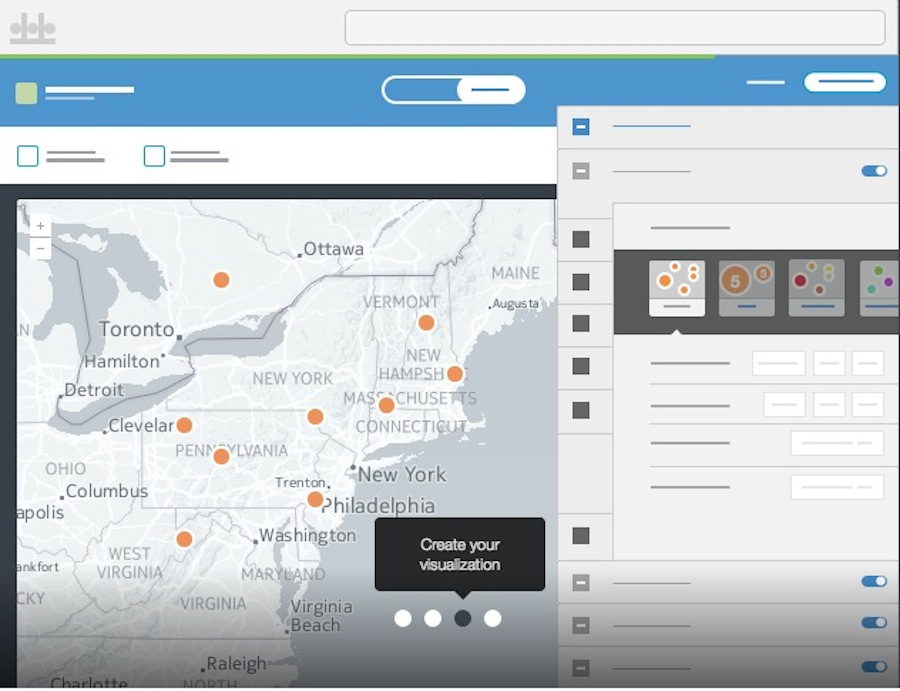
- Tour of the interface
- APIs / JS Libs
- Data Import + Sync Tables
- Customizing UI + CartoCSS
- Creating Custom Maps
- Mapping in the Editor
- Mapping in Code
- Python
- Node
- R
- Building a Narrative
- Case Study 1: NYC Building Choropleth Map
- Case Study 2: NYC Bikelane Category Map
- Cast Study 3: Multivariate Data Map App
- Tell Time/Stories: Odyssey + Torque
- Partner Graphics: Graphs + Charts
- Resources
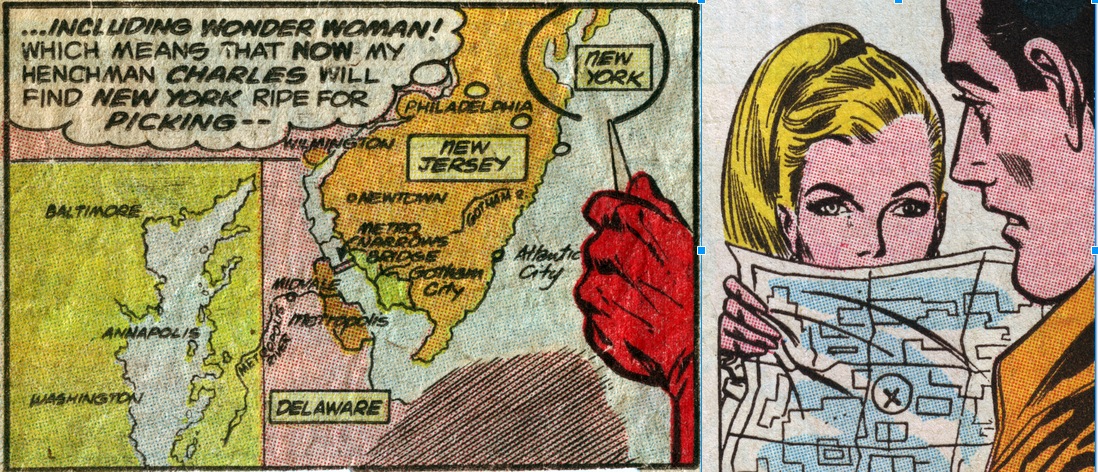
YOU ARE HERE.
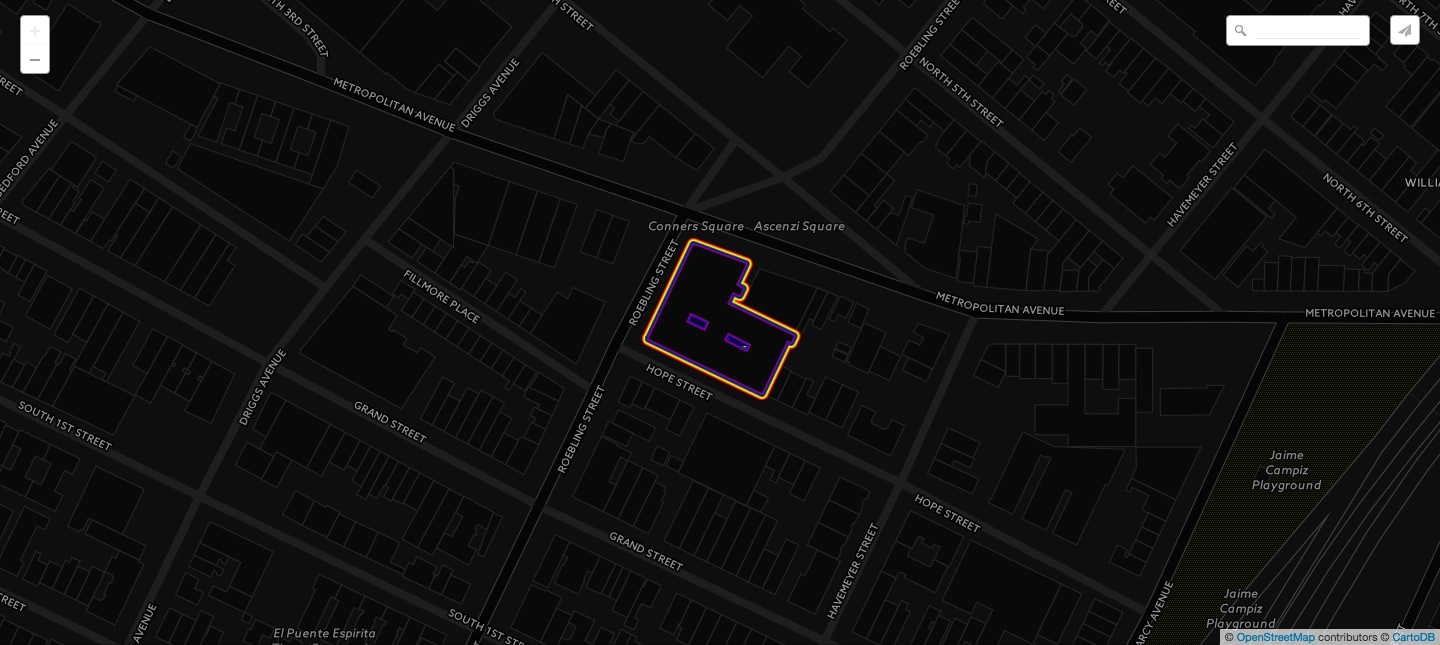
Where are you? If I gave you directions here, you could say you were at
143 Roebling St Brooklyn, NY 11211
But if I wanted to describe the location as a point on a map, I might describe the same location using latitude and longitude:
40° 71' 42.49", -73° 95' 74.07"
It reads as "40 degrees, 71 minutes and 42.49 seconds, negative 73 degrees, 95 minutes and 74.07 seconds"
We describe locations with a spatiotemporal notation, it's also somewhat obscure. So let's describe the same place using longitude and longitude but using decimal degrees instead of minutes and seconds. There are a number of conversion tools available online to do this:
40.714249, -73.957407
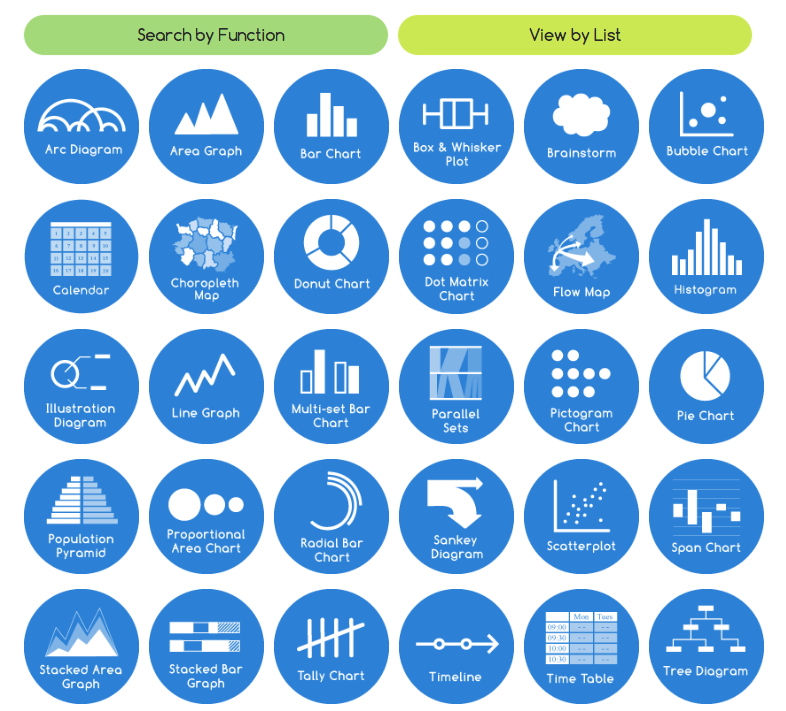
###Types + Topics
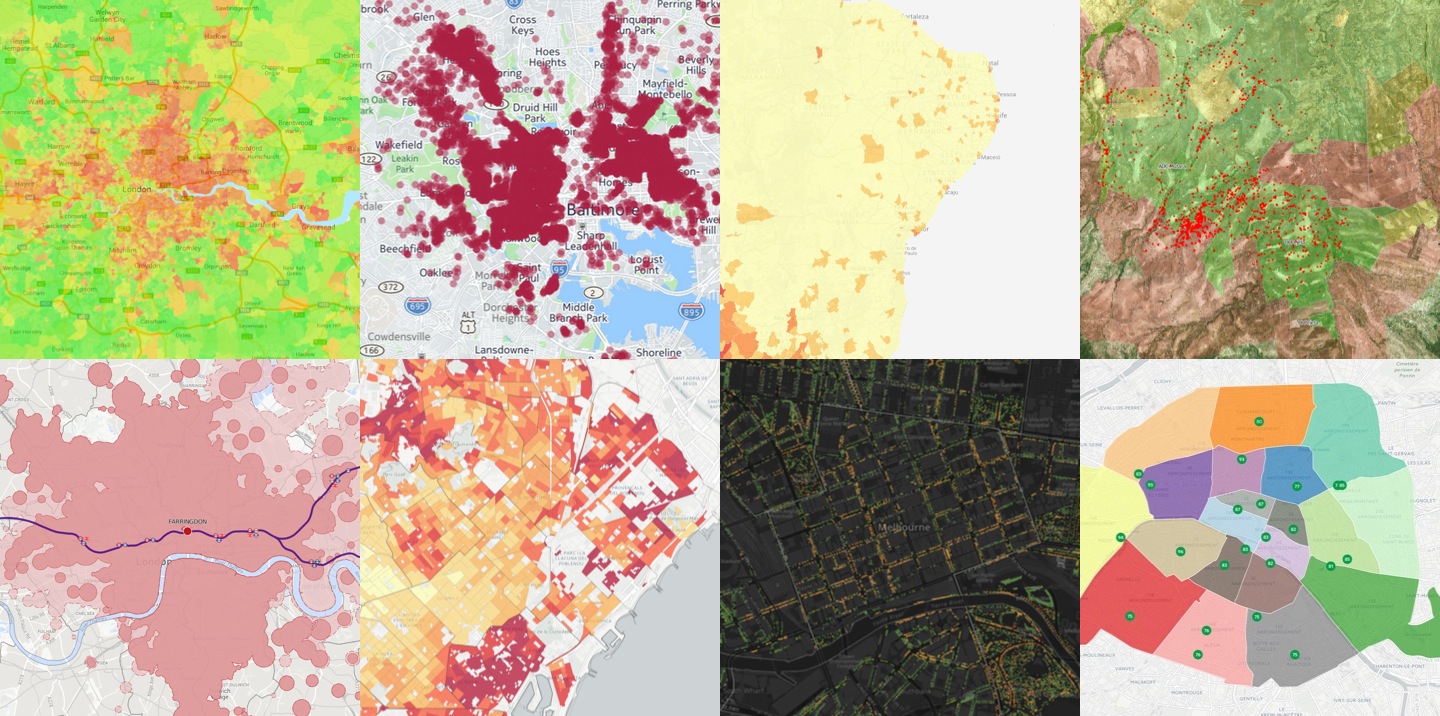
There are many different types of map you can make, browse this gallery to view some options. Most maps illustrate some kind of geospatial change.
DYNAMIC MAPSs
Source: The Data Visualization Catalogue.
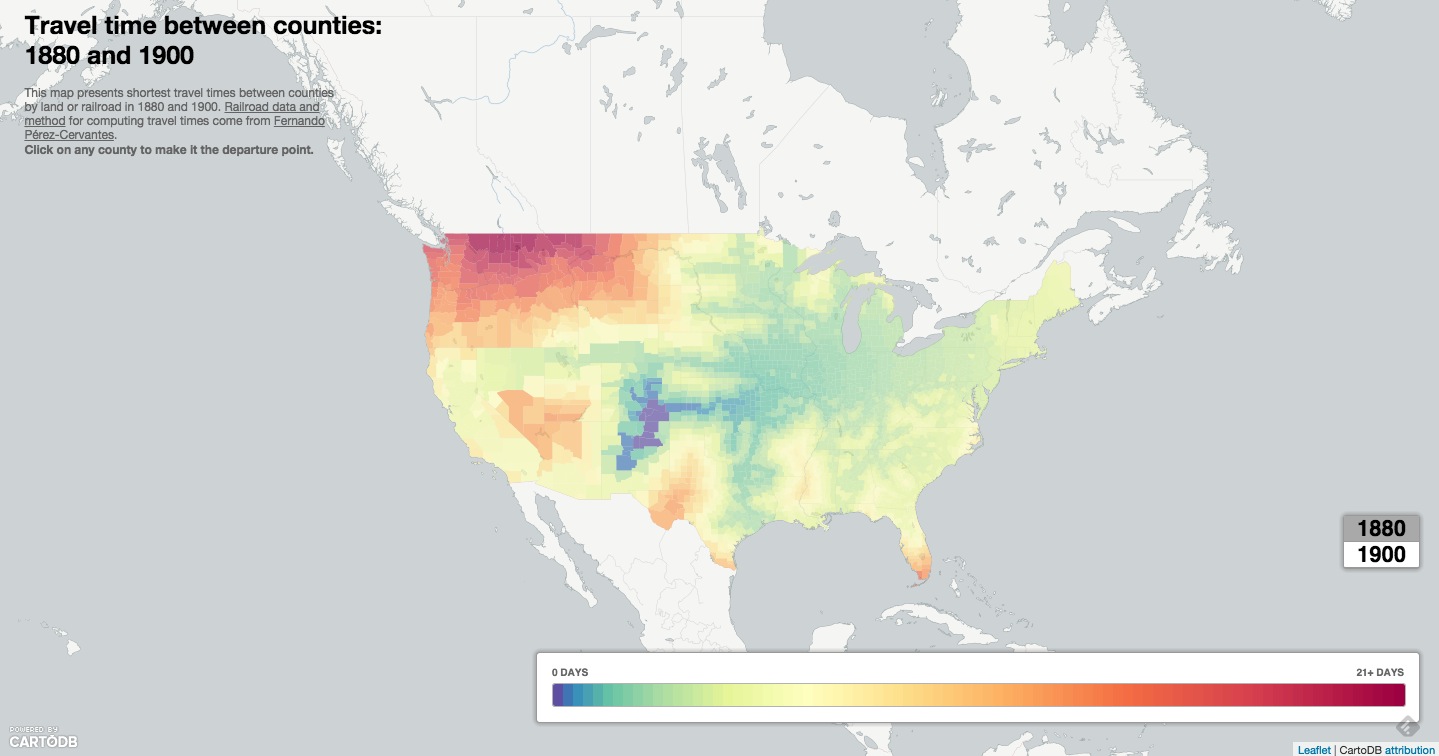
Source: Time Travel Between Counties, Carto.JS
DATA SEARCH TOOLS
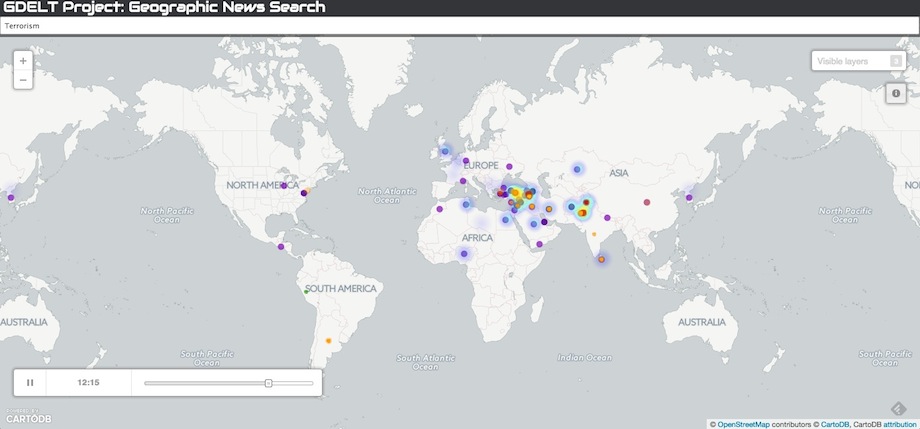
Source: GDELT Geographic News Search Tool
Journalists have used the GDELT data to track wildlife crime, and the spread of the Islamic State in the Middle East among other things.
You can fork the GDELT hourly synced data set from the CartoDB DataLibrary and add it as a layer on your map or use the Geographic Search Tool linked above to search for tags of interest.
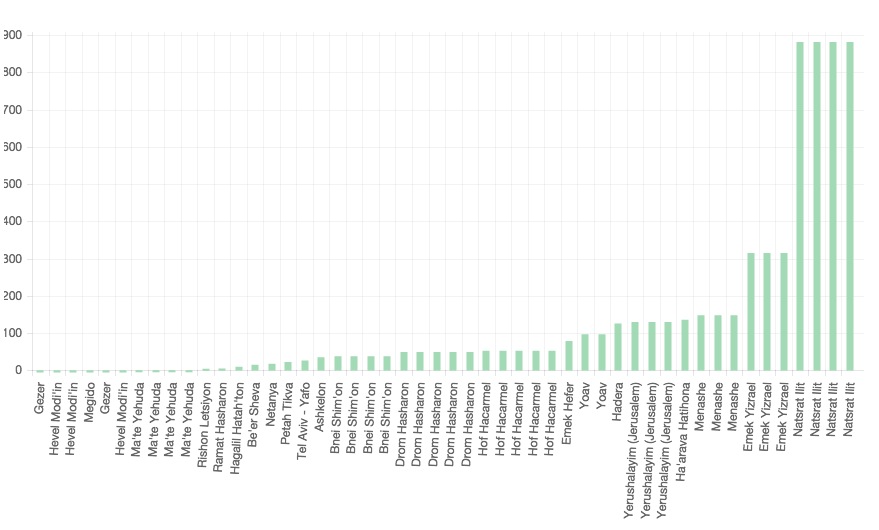
CHART GRAPHICS
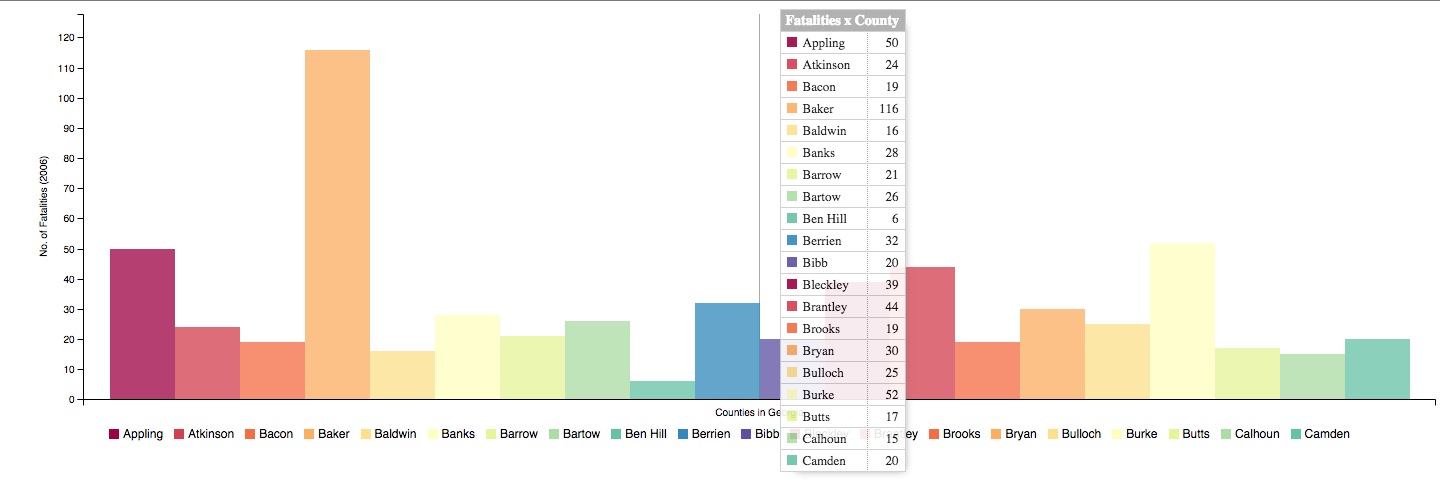
Source: Geogia County Car Crash Counts, C3.JS
COMPARISON NARRATIVE
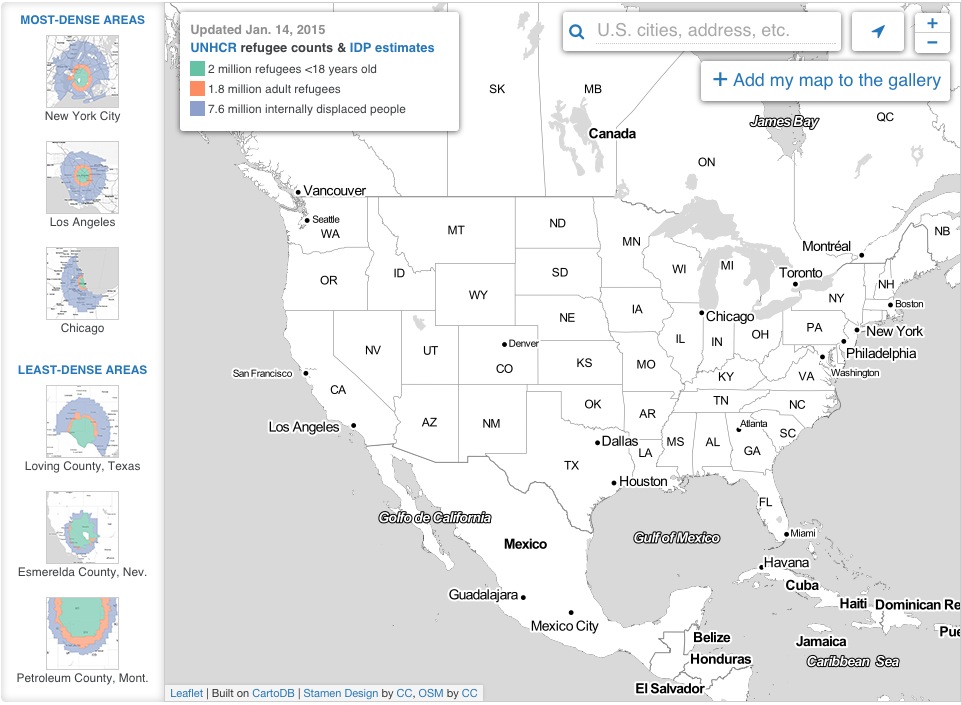 Map population by relative density
- Maps give you more context than most visualizations.
- They allow you to apply data to a recognizable topography.
Sources
- CartoDB: light open source library and graphical user interface application for hosting and visualizing geospatial data
- ChartJS: light library for creating charts and graphs
- GDELT: the global database of events languages and tones
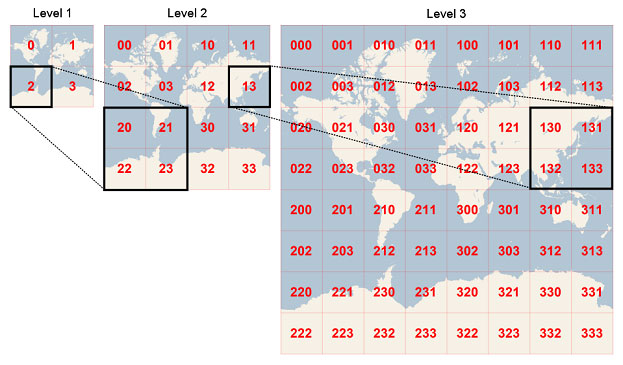
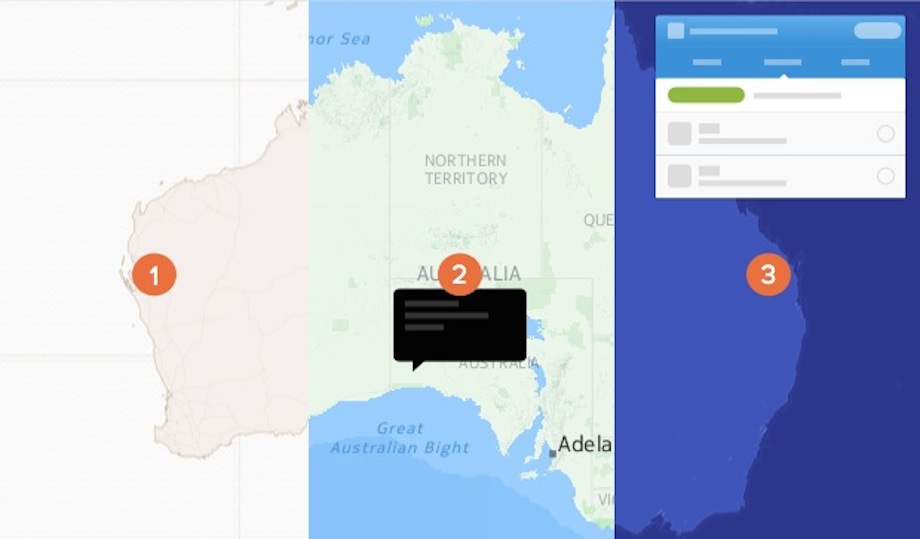
Maps are composed of:
####1. Tiles (often)
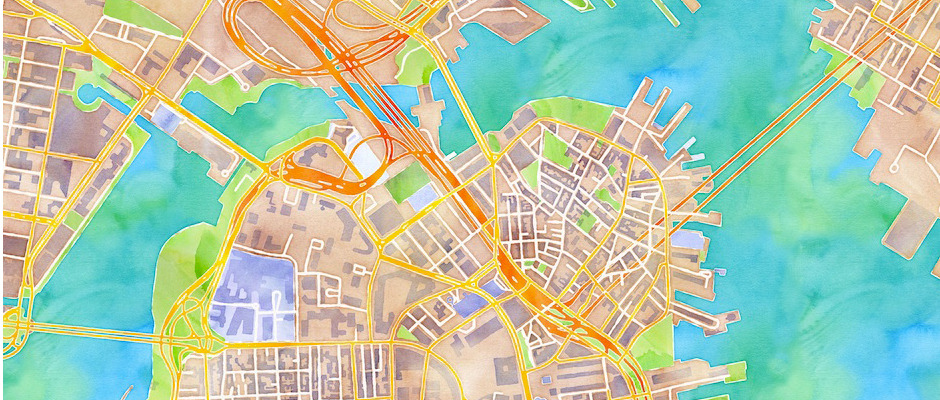
Tiles are 256x256 pixels squares that plot one next to the other to stitch together a pseudo-seamless image; the tiles draw dynamically as you focus and zoom in on your map so that the map draws on a continuous canvas
####2. Feature Layers
Map layers that populate on top of your basemap
####3. Javascript/HTML/CSS for rendering on the web
With these languages you can publish your map with the basetiles loaded and your data layers appropriately geocoded; with javascript you can also add to the interactivity of your map, revealing metadata in the tooltips
You can get geospatial data for your feature layers in lots of places. Here are some examples.
- Columbia University GeoSpatial Datasets
- Curated List of NYC Data
- NYC DOT DataFeeds
- NYC Open Data Portal
- Beta NYC's NYC Open Data Sources
- NYC Citizen Complaint Review Board
- Federal Data Resources
We'll be collecting data from multiple sources. Most of which are available in the repository where our data will be stored. In this case, point (library), lines (bikelanes), and polygons (building footprints).
BIKELANES
LIBRARIES
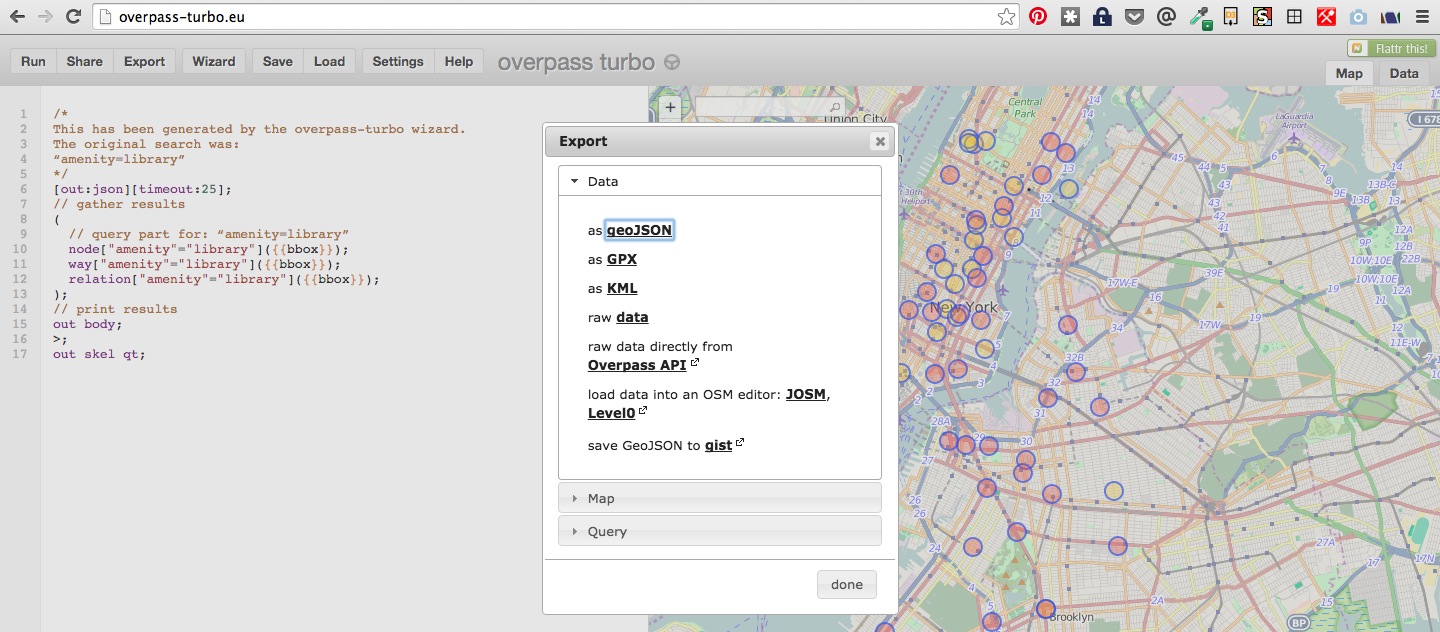
- OSM: Open StreetMap + Overpass Turbo
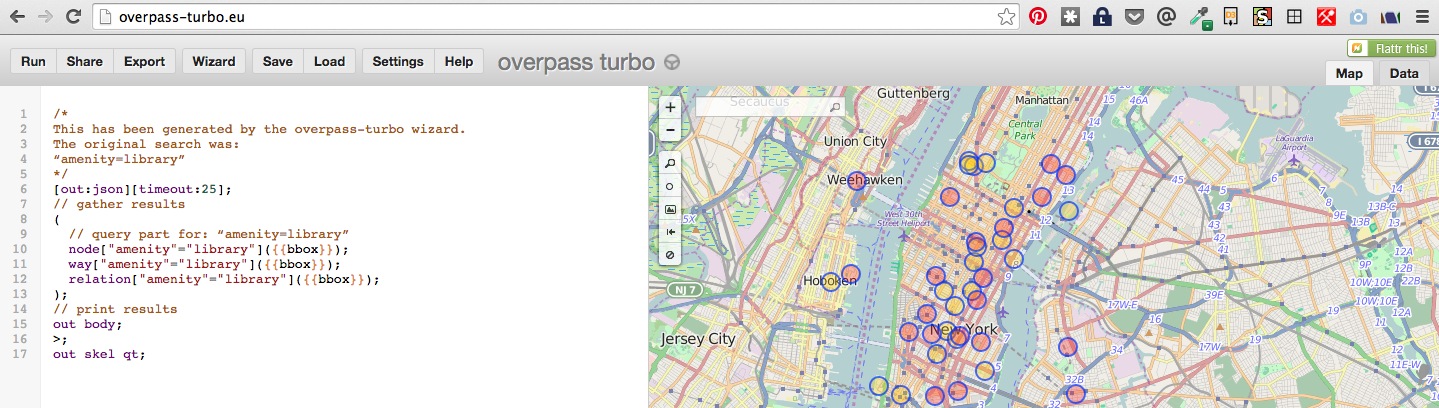
You can read more about Overpass on the Open Street Map Wiki.
Steps:
- Pan manually to an area in OverPass Turbo
- Go to the "Wizard"
- Look up the appropriate OSM tag in the OSM wiki
- Search for "amenity=library" or whatever
- Export your data as GeoJson or KML
- Upload into CartoDB or another interface
Notes:
- only nodes, only ways, only relations (-> limit so it doesn't map data you're not interested in)
- search for something that is too large it freezes (-> define your bounding box)
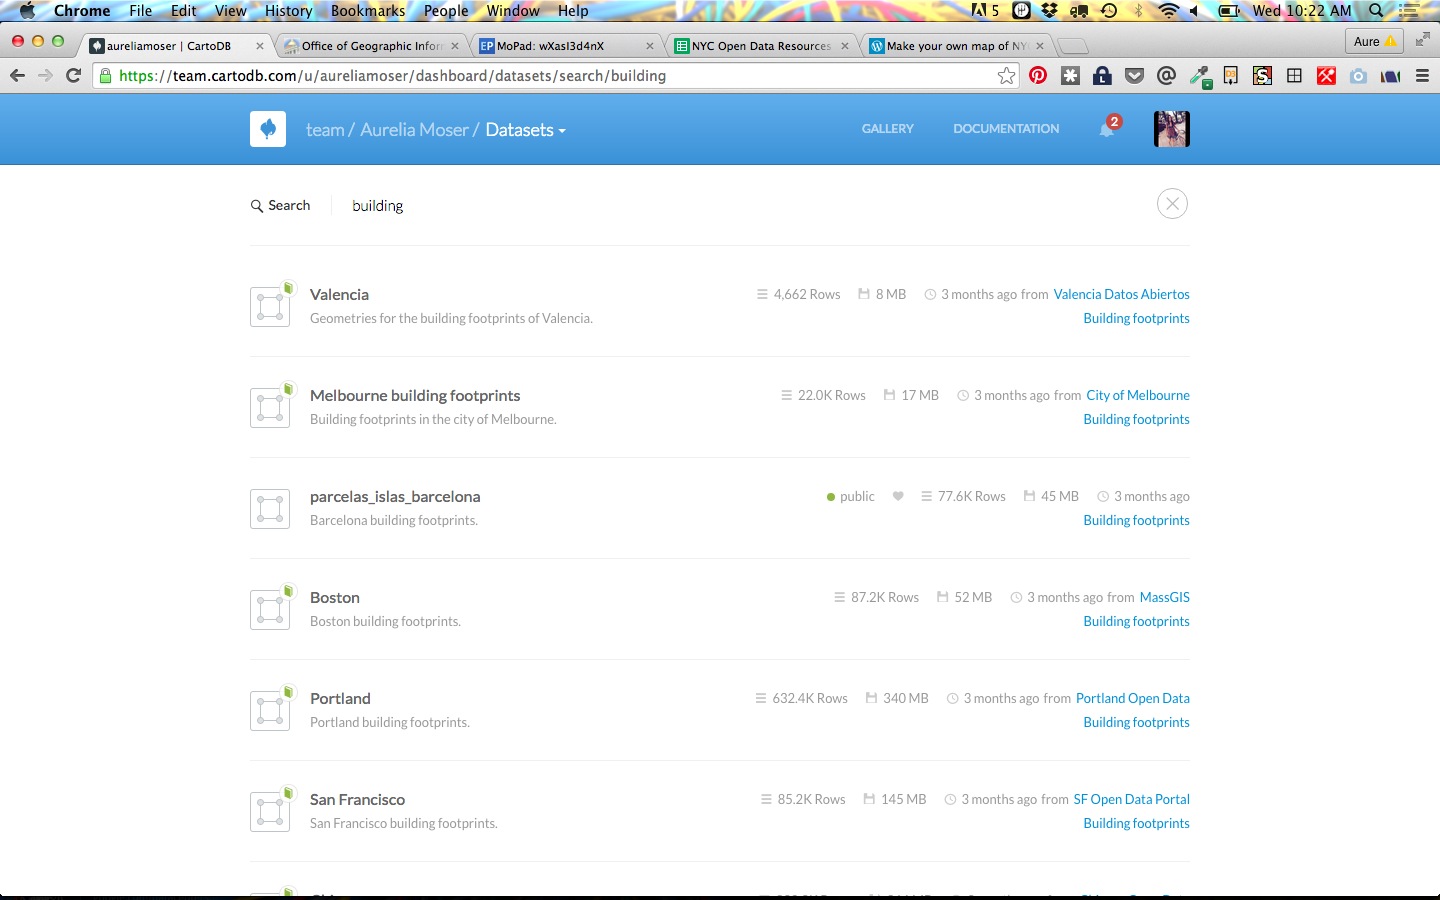
BUILDINGS
- CartoDB Data Library
There are lots of geospatial data formats that may or may not be easy to parse. Here's a short list of ones that are commonly imported into CartoDB.
So let's take a look at this library data. You want to lead people to all of the libraries in NYC. You can use the kml file here in the data folder.
You can get the libraries from OSM or NYC Open Data but let's go with the KML from OSM that we extracted with OverPass.
.kml which is a notation for XML that first made popular by Google Earth before becoming standardized. Google Mapping Products happily use kml files. Check to see how the locations are described:
<?xml version="1.0" encoding="UTF-8"?>
<kml xmlns="http://www.opengis.net/kml/2.2"><Document>
<name>overpass-turbo.eu export</name>
<description>Filtered OSM data converted to KML by overpass turbo.
Copyright: The data included in this document is from www.openstreetmap.org. The data is made available under ODbL.
Timestamp: 2015-08-19T17:02:03Z</description>
<Placemark><name>SC Williams Library</name><Polygon>
<outerBoundaryIs>
<LinearRing><coordinates>-74.0254348,40.7450718 -74.0255769,40.7445846 -74.0251885,40.7445156 -74.0251471,40.7446466 -74.0251306,40.7446862 -74.0250324,40.7450032 -74.0254348,40.7450718</coordinates>
</LinearRing>
</outerBoundaryIs></Polygon><ExtendedData><Data name="@id"><value>way/26974141</value></Data>
<Data name="amenity"><value>library</value></Data>
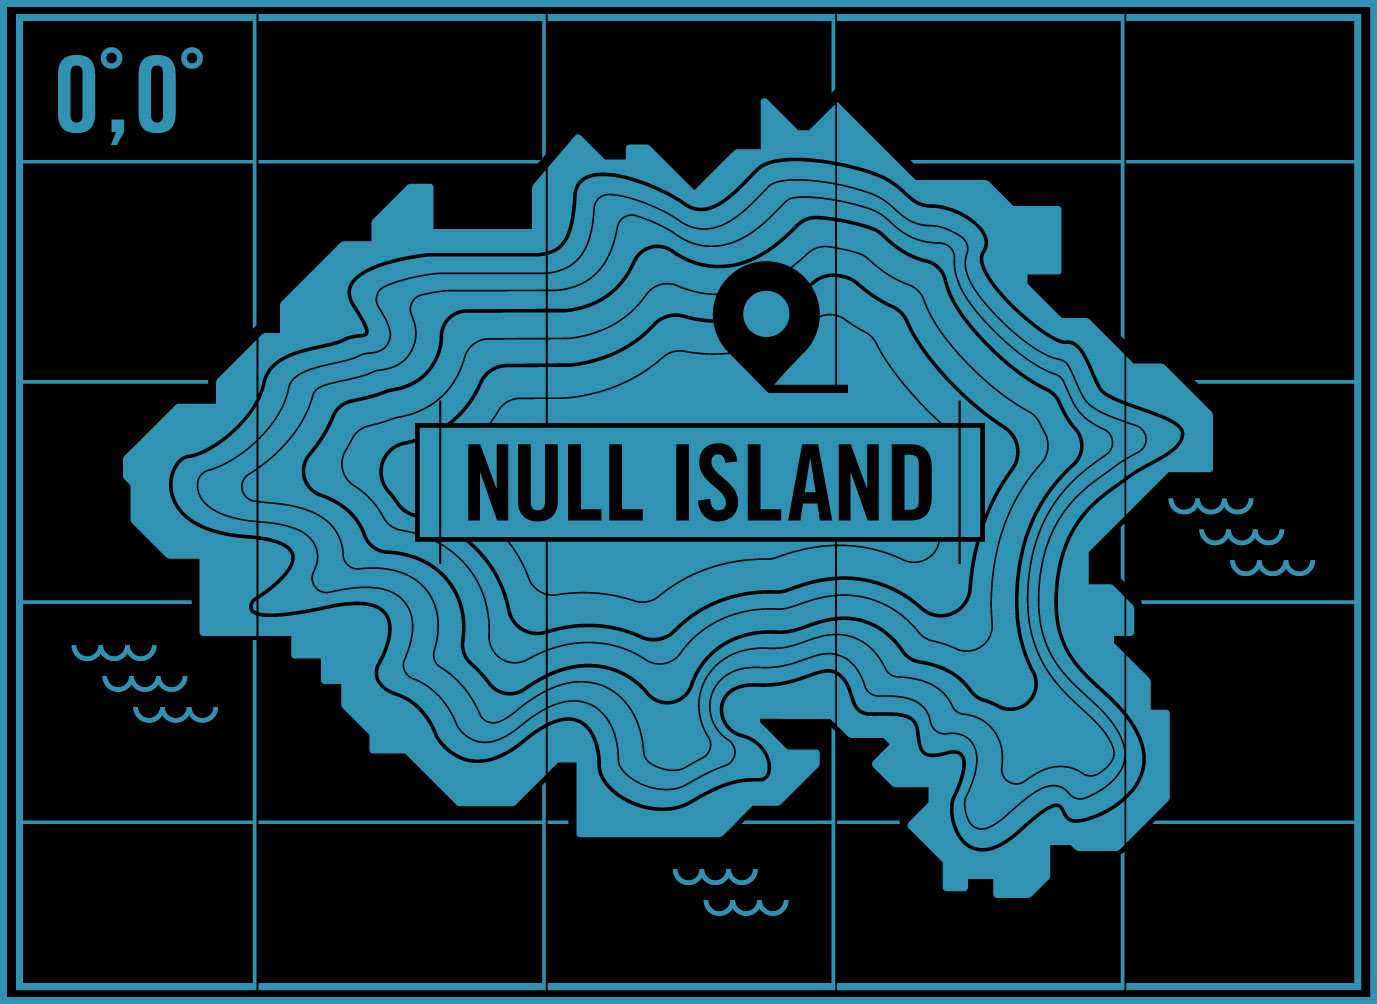
...Notice that the point coordinates are in the format longitude, latitude. Some geoformats are long, lat and others are long, lat. This makes everyone sad.
When coordinates cannot easily be parsed they go to "null island," a fictional place at coordinates (0,0).
In a bit, we'll show how you can convert, process and use a file like this to plot data on your map!
CartoDB is a PostGres database in the cloud, which means it handles a lot of your backend data needs and allows you to query for data and pull those data and basemap tiles into your front-end code.
You can also store your data in Github, or in another service that makes it web accessible. Read more about that here and here.
There are loads of ways to approach a map here are a few approaches to mapping the same dataset.
We can make a map with the libraries data, or other data in the gdi data folder for this workshop.
Using Google Maps
- https://www.google.com/maps/d/
- create account if you don't already have a Gmail account
- click on Import Map in top left hand menu (or My Maps -> Create map in some Google Maps UIs)
- upload
libraries.kml - explore changing the map features if you would like
Using Mapbox
- https://mapbox.com/
- create account if you don't already have a Mapbox account
- click on the Data tab at the top right hand corner of the screen; * click on import
- upload
libraries.kml - select map features if you would like then click on Import Features explore changing the map features if you would like
Using CartoDB
- https://cartodb.com/
- create account if you don't already have a CartoDB account, use this URL to get boosted features
- click on Create Map; select Map View at the top of the screen
- click on the '+' or Add Layer option at the top of the right side menu
- upload
libraries.kml - explore changing the map features if you would like
Using Leaflet
You can also make a map from scratch using Leaflet.js (http://leafletjs.com/) to attach a set of points to a map made of tiles provided by OpenStreetMap.
You will first need to convert your kml file into GeoJSON (although I have both in the data folder) for this workshop.
GeoJSON is a file format that is easily digestable by JavaScript. If you have a data format (shp, kml) that is not geojson you can convert it to the right format for your code with GeoJSON.io/
- go to http://geojson.io/
- from the menu Open select File and upload our kml file: https://github.com/copystar/do15/blob/master/combined-library-data.kml
- notice how GeoJSON looks like in the side-menu
{
  "type": "FeatureCollection",
  "generator": "overpass-turbo",
  "copyright": "The data included in this document is from www.openstreetmap.org. The data is made available under ODbL.",
  "timestamp": "2015-08-19T17:02:03Z",
  "features": [
    {
      "type": "Feature",
      "id": "way/26974141",
      "properties": {
        "@id": "way/26974141",
        "amenity": "library",
        "designation": "Library",
        "name": "SC Williams Library"
      },
      "geometry": {
        "type": "Polygon",
        "coordinates": [
          [
            [
              -74.0254348,
              40.7450718
            ],
- after the map is drawn, from the menu Save, select *GeoJSON"
- refer to "Adding GeoJSON to Leaflet with Link Relations" : http://lyzidiamond.com/posts/osgeo-august-meeting/ to find the HTML that use can use as a template that will import GeoJSON into a map created by Leaflet.js
- use http://{s}.tile.osm.org/{z}/{x}/{y}.png for your map tiles
- use libraries.geojson for your geojson layer: https://github.com/auremoser/gdi-webmap/blob/master/libraries.geojson
- explore changing the map features if you would like using Leaflet.js: http://leafletjs.com/
- Alcatraz Escape Revisited
- LA Sheriff Election Results
- Starwars Galaxy Map
- Demonstrations in Brazil
- Global Forest Watch
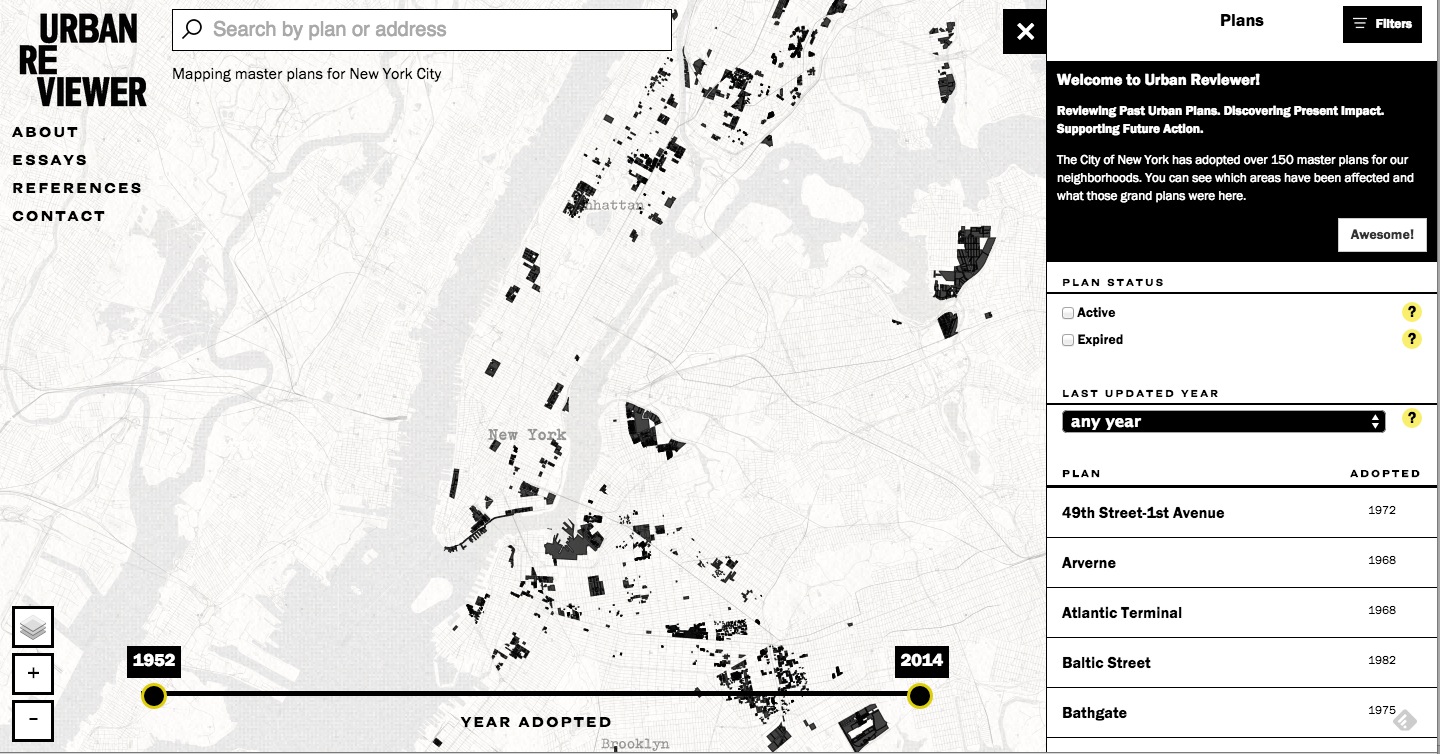
- Urban Reviewer
We'll use CartoDB for the subsequent exercises because of it's flexibility, support for SQL and JS, and backend handling for data management and geocoding.
You can read more about the CartoDB APIs and JS Library here
- CartoJS - JS library for interacting with CartoDB
- Maps API - generate public/private maps with data hosted on your CDB account
- SQL API - run sql in your code to dynamically filter/request/query your mapped data stored in CartoDB via http calls
- Import API - push data to your CartoDB Account
Geospatial data is info that ids a geolocation and its characteristic features/frontiers, typically represented by points, lines, polygons, and/or complex geographic features.
Issues:
- Comes in multiple formats (supported formats for CartoDB)
- Sources uncertain
- Contains errors
- etc.
Geocoding + SQL/PostGIS The most basic SQL statement is:
SELECT * FROM table_nameSELECTis what you're requesting (required)FROMis where the data is located (required)WHEREis the filter on the data you're requesting (optional)GROUP BYandORDER BYare optional additions, you can read more about aggregate/other functions below.
There are two special columns in CartoDB:
the_geomthe_geom_webmercator
The first of these is in the units of standard latitude/longitude, while the second is a projection based on the original Mercator projection but optimized for the web.
If you want to run SQL commands and see your map update, make sure to SELECT the the_geom_webmercator because this is the column that's used for mapping--the other is more of a convenience column since most datasets use lat/long.
Sync Tables
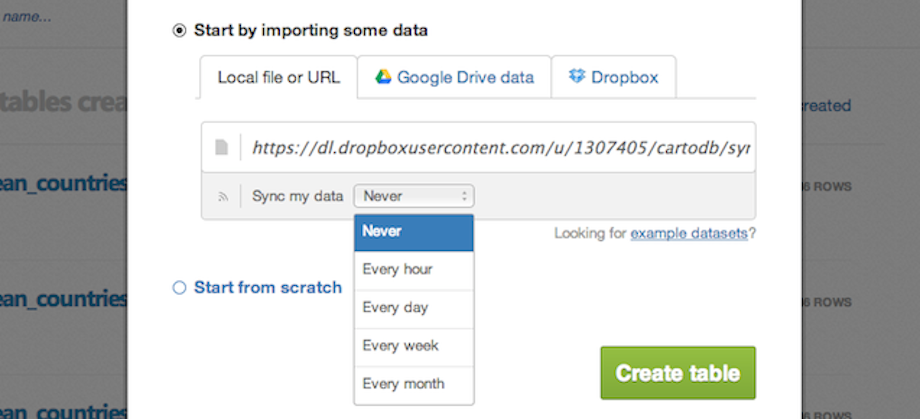
The Editor is especially setup to process realtime data updates via sync tables.
You can import data that lives online via a URL, and set it to pull and update your map at regular intervals.
Check the file types supported in sync tables; keep in mind that it also works with dropbox + google drive.
Notes:
- to auto-geocode a sync table, verify that it contains the following:
- country column, a latitude column and a separate longitude column
- a column of IP addresses
- to edit sync tables you need to be disconnected from the datasource, so during syncing, you can use SQL to manipulate the dataset on the fly
- you can create sync tables in both the Editor and via the Import API
You have myriad customization options in the in-browser editor:
sql- run sql and postgis functions across your datawizard- adjust the type, colors and fills in your mapinfowindow- create hovers, tooltips with information from your datatablescss- customize the css and style of your map outside the wizardlegends- create keys for your mapfilters- filter the data without sql
Likewise, many types of visualizations:
- Simple -- most basic visualization
- Cluster -- counts number of points within a certain binned region
- Choropleth -- makes a histogram of your data and gives bins different colors depending on the color ramp chosen
- Category -- color data based on unique category (works best for a handful of unique types)
- Bubble -- size markers based on column values
- Intensity -- colors by density
- Density -- data aggregated by number of points within a hexagon
- Torque -- temporal visualization of data
- Heat -- more fluid map of concentration; emphasis on far over near-view
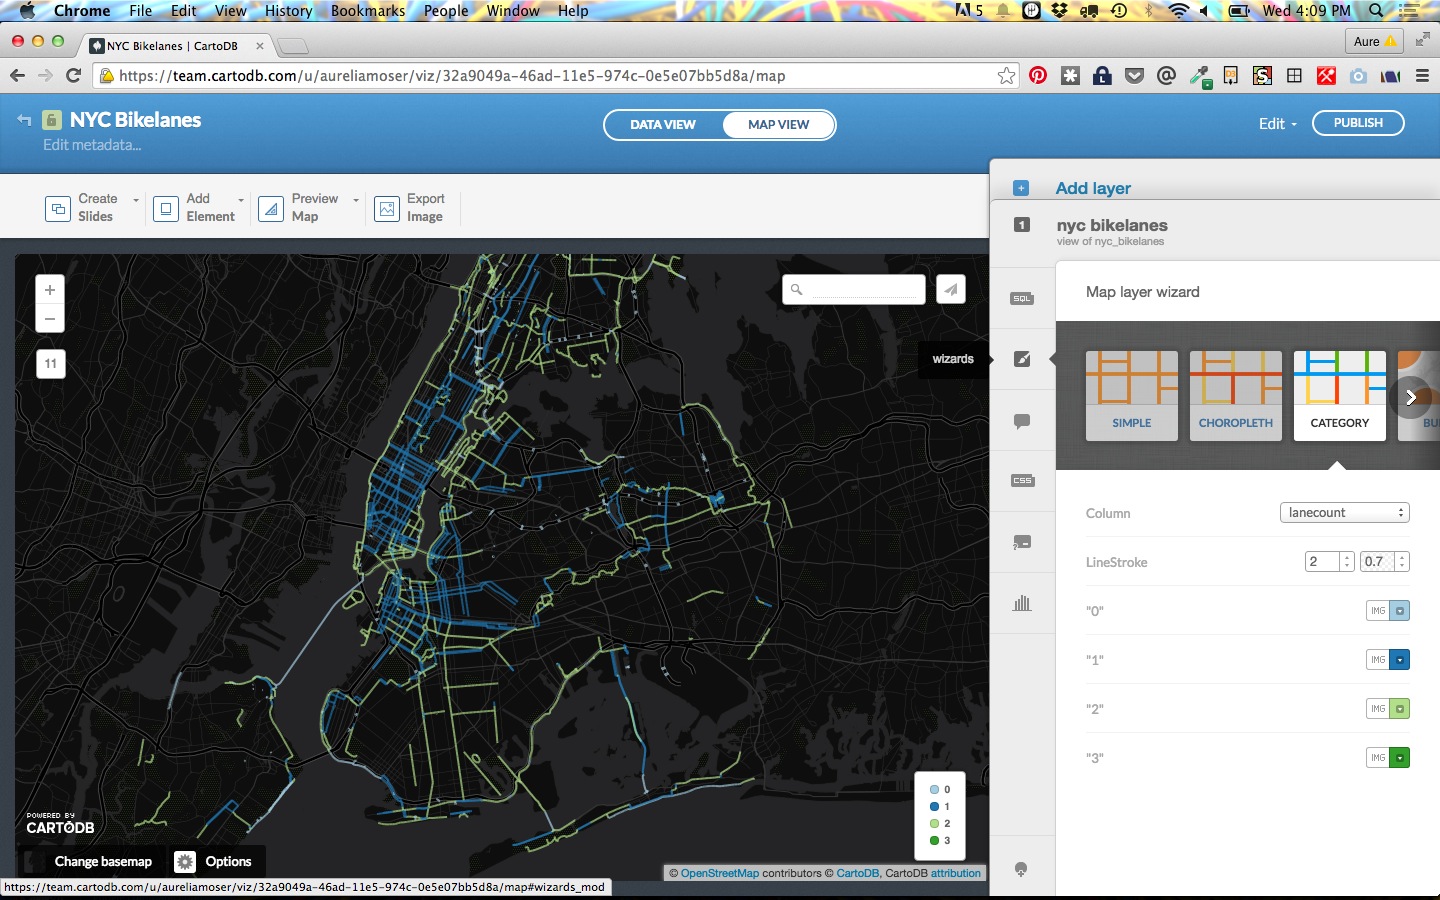
The Editor GUI allows you to select your visualization "type" and customize color palettes, design details, and otherwise set the tone for your map. It also gives you ways to run sql and set your cartocss in the browser before you input those things as templates in your code.
- Marker Fill: change the size, color, and opacity of all markers
- Marker Stroke: change the width, color, and opacity of every marker's border
- Composite Operation: change the color of markers when they overlap
- Label Text: Text appearing by a marker (can be from columns)
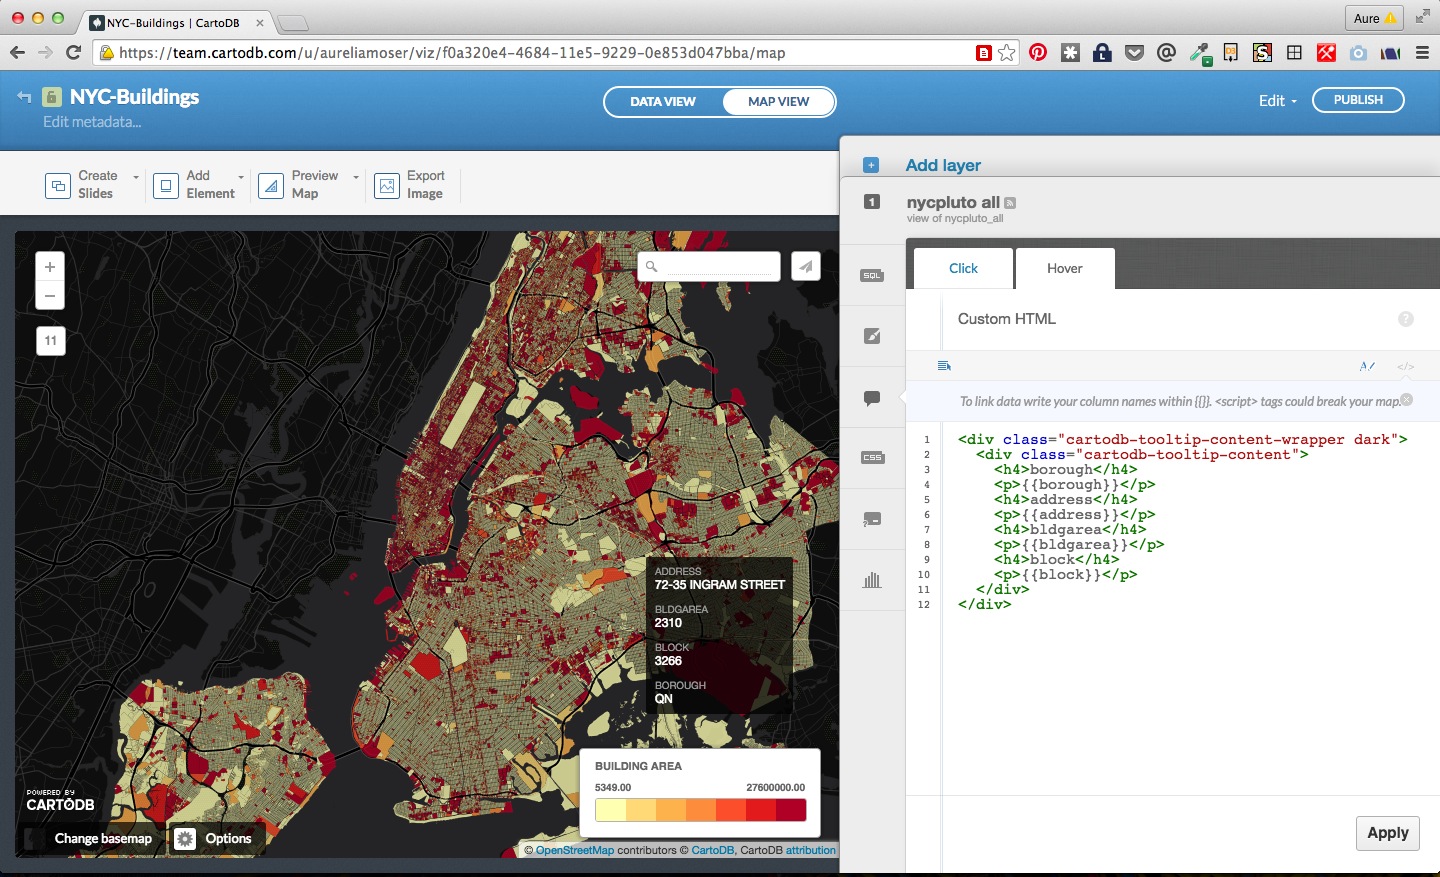
- Select which column data appear in infowindow by toggling column on
- Customize further by selecting HTML-view
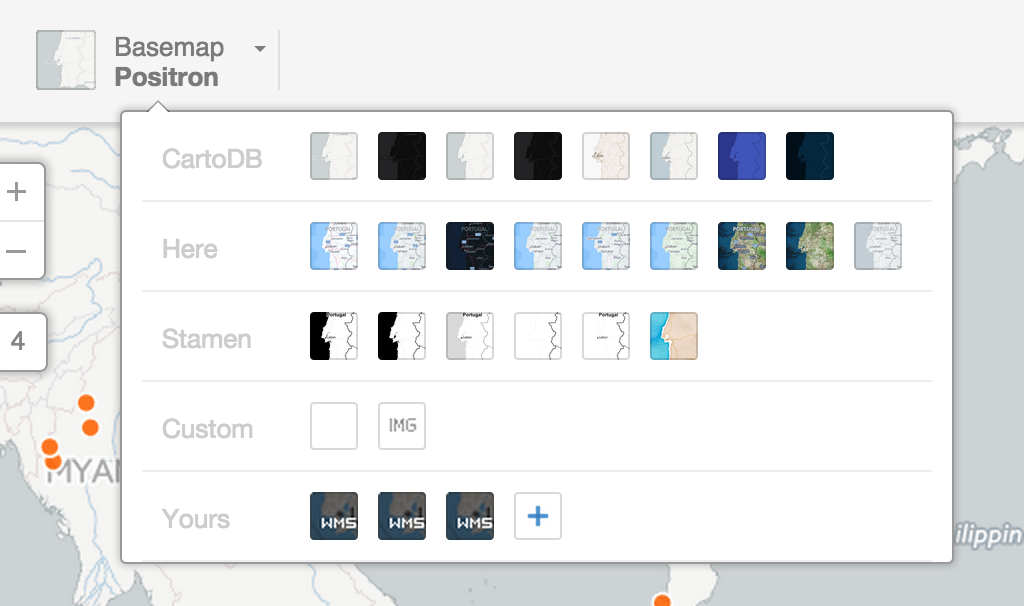
Check out the base CartoDB Basemaps from Stamen.
Use the CartoDB Python module to create and update tables; check out Andy's IPythonNB demos.
Use the CartoDB Uploader package available in NPM for working in Node.js
Use Kyle Walker's R2CartoDB project to create and update tables in R.
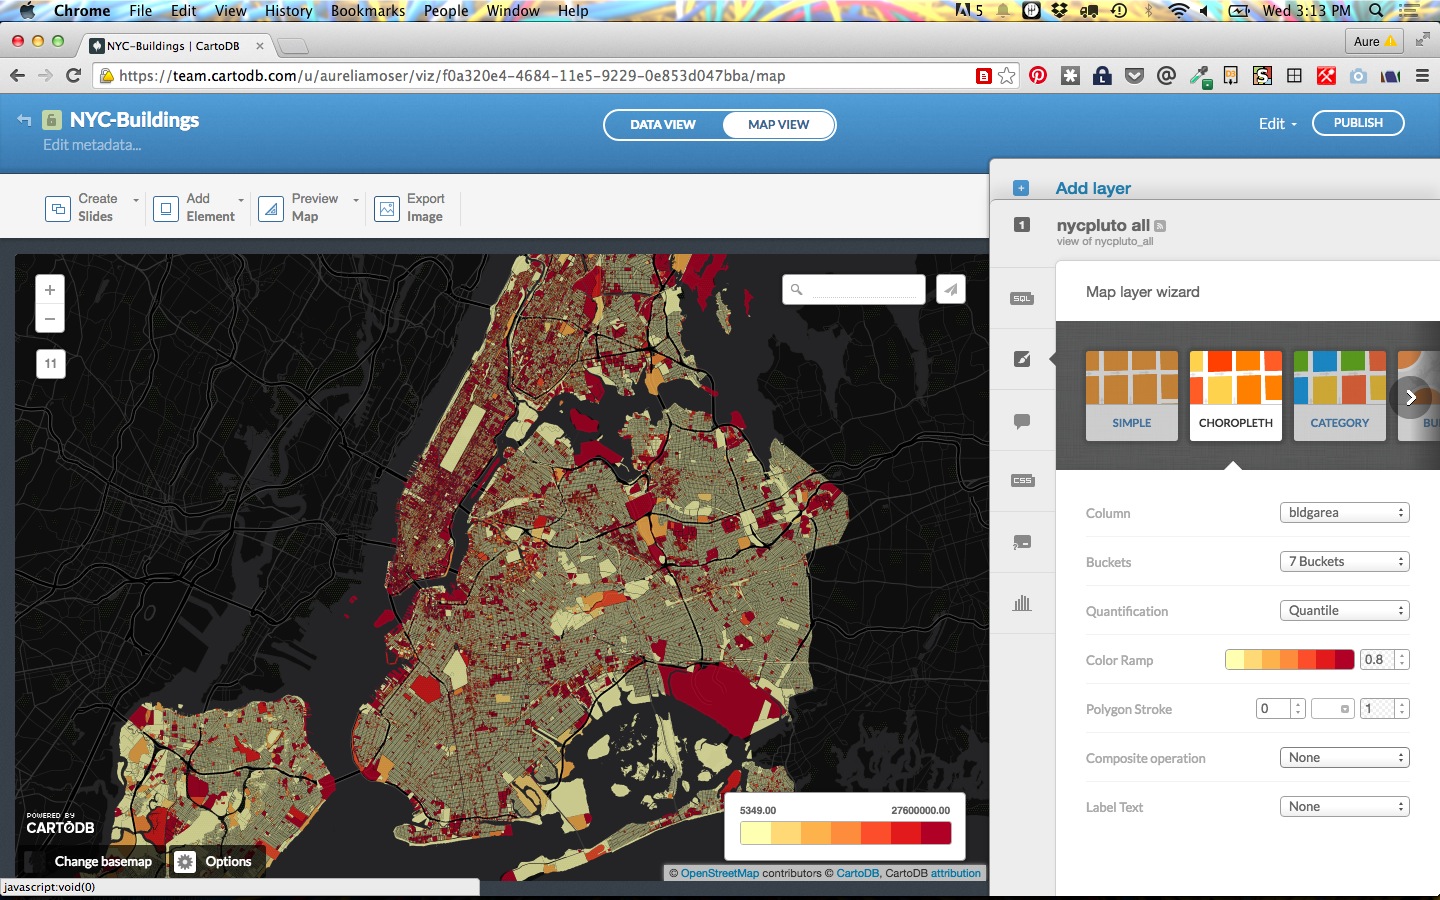
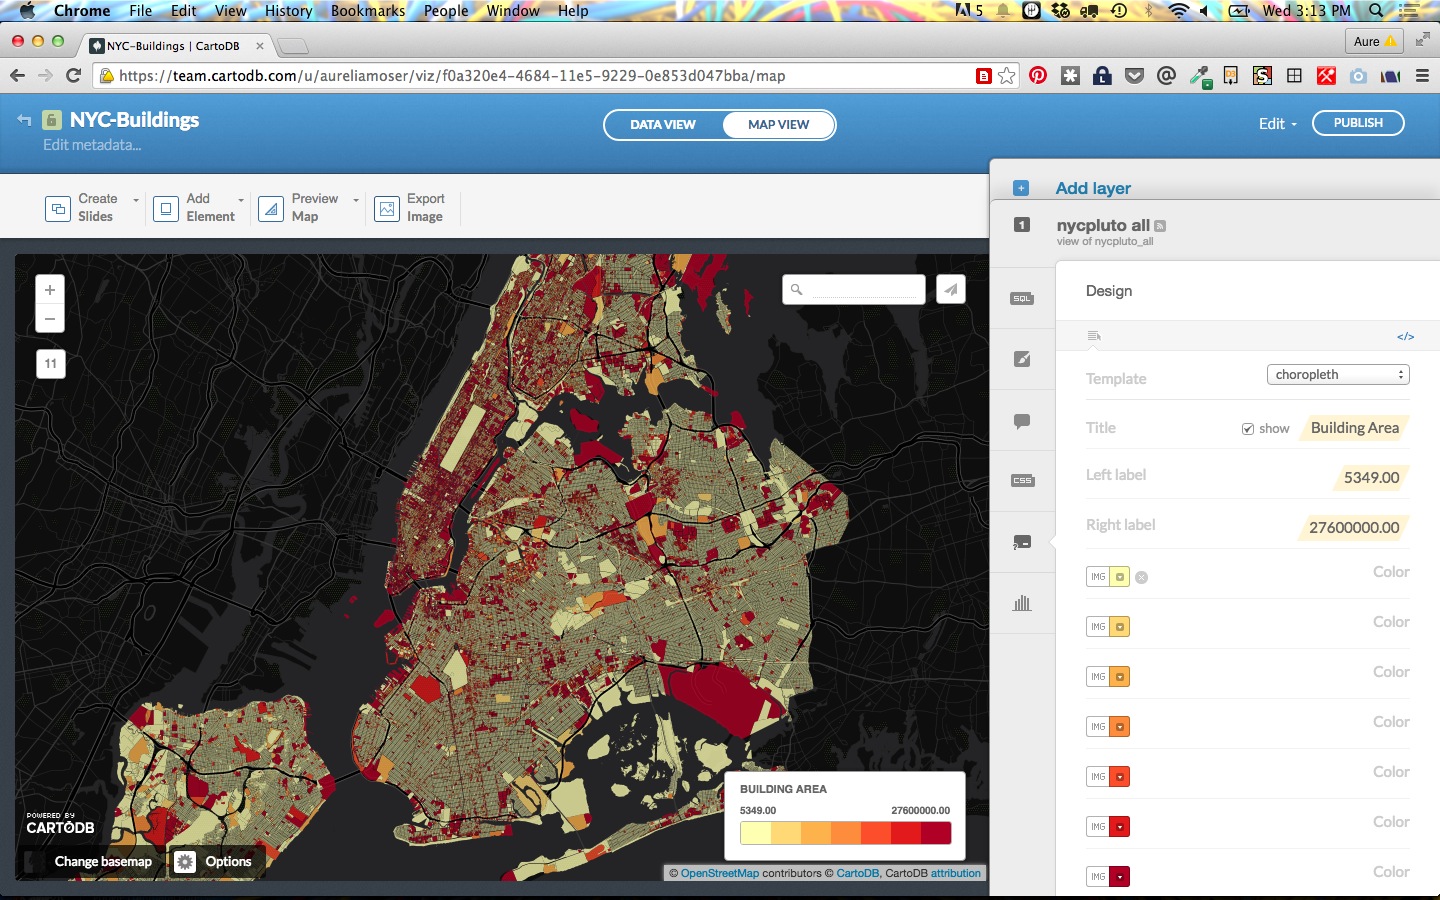
Case Study 1: NYC Building Choropleth Map
The data folder includes some point (libraries), line (bikelanes), and polygons (building footprints) for NYC. You can make a map with any one of these, or a dataset of your choosing.
Let's try the Building Footprint Data, making something like this.
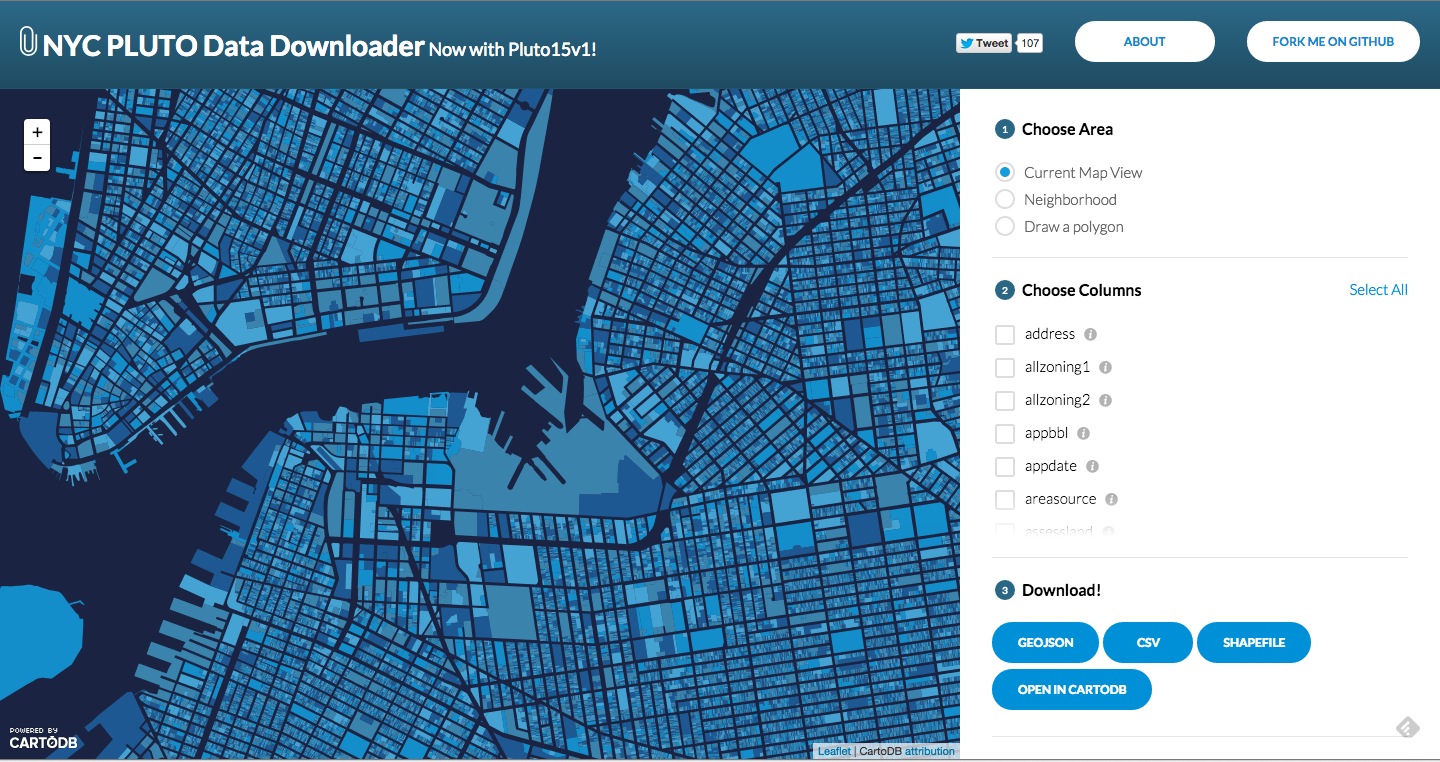
- Navigate to your Data Library in CartoDB
- Search for 'PLUTO' and select the NYC data; or Use the NYC PLUTO data Downloader linked above
- "Connect Dataset"
- "Create Map"
- Adjust aspects in the GUI
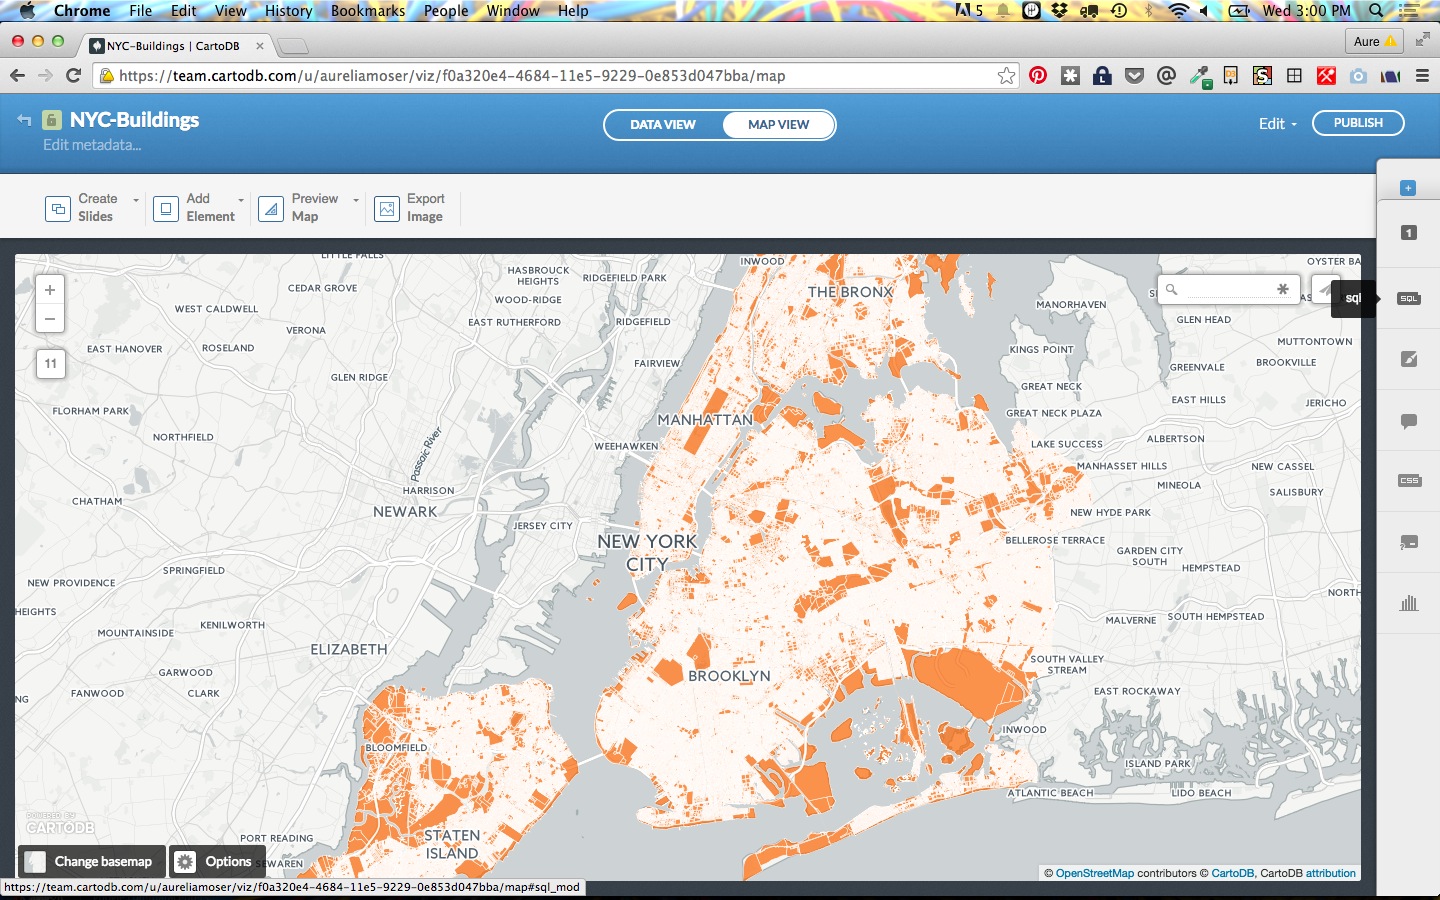
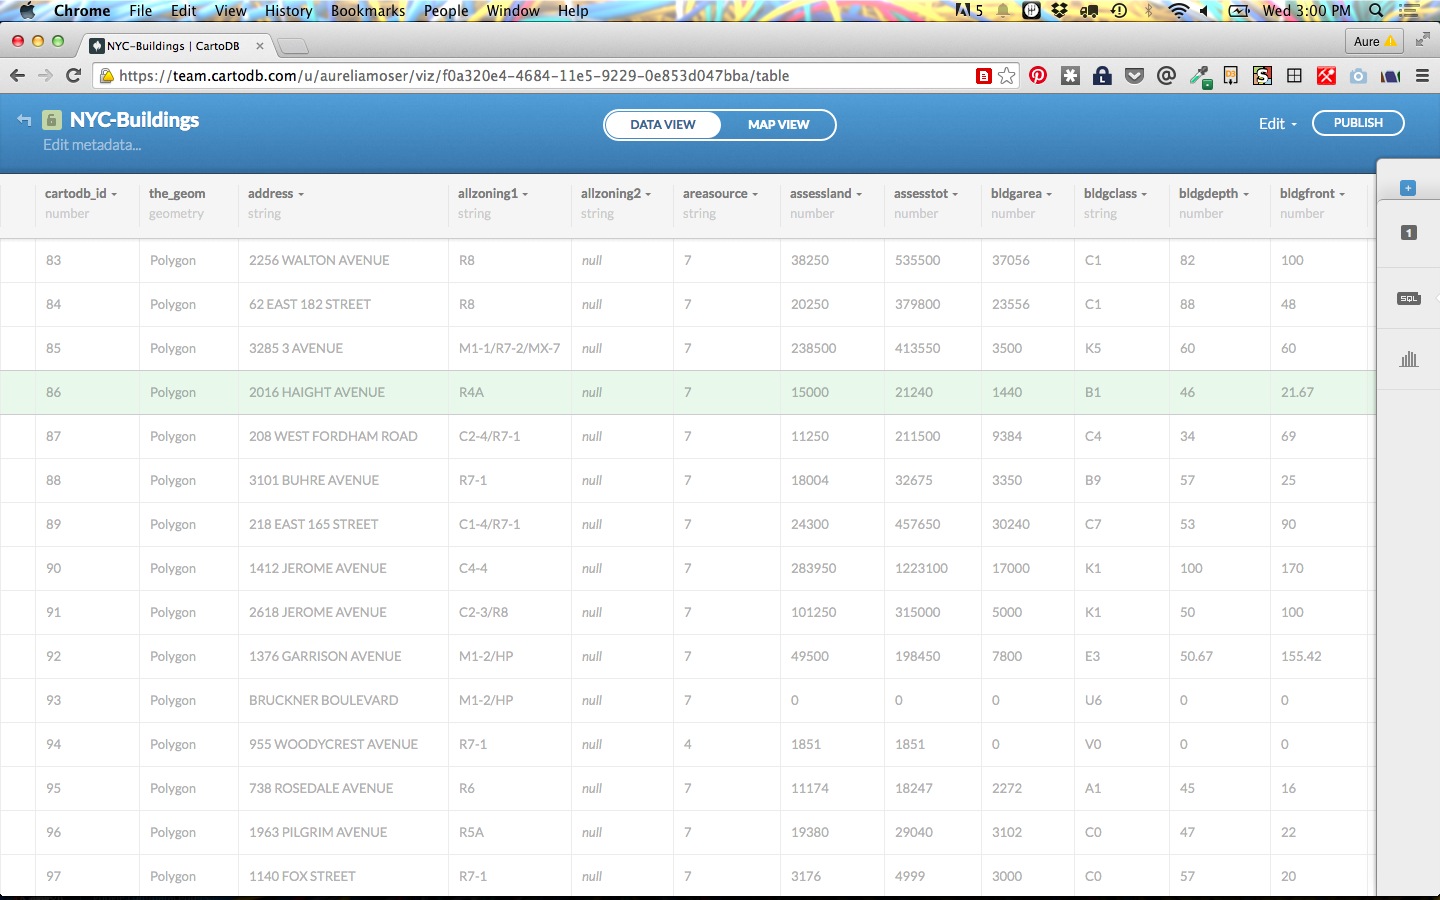
EXPLORE THE DATA
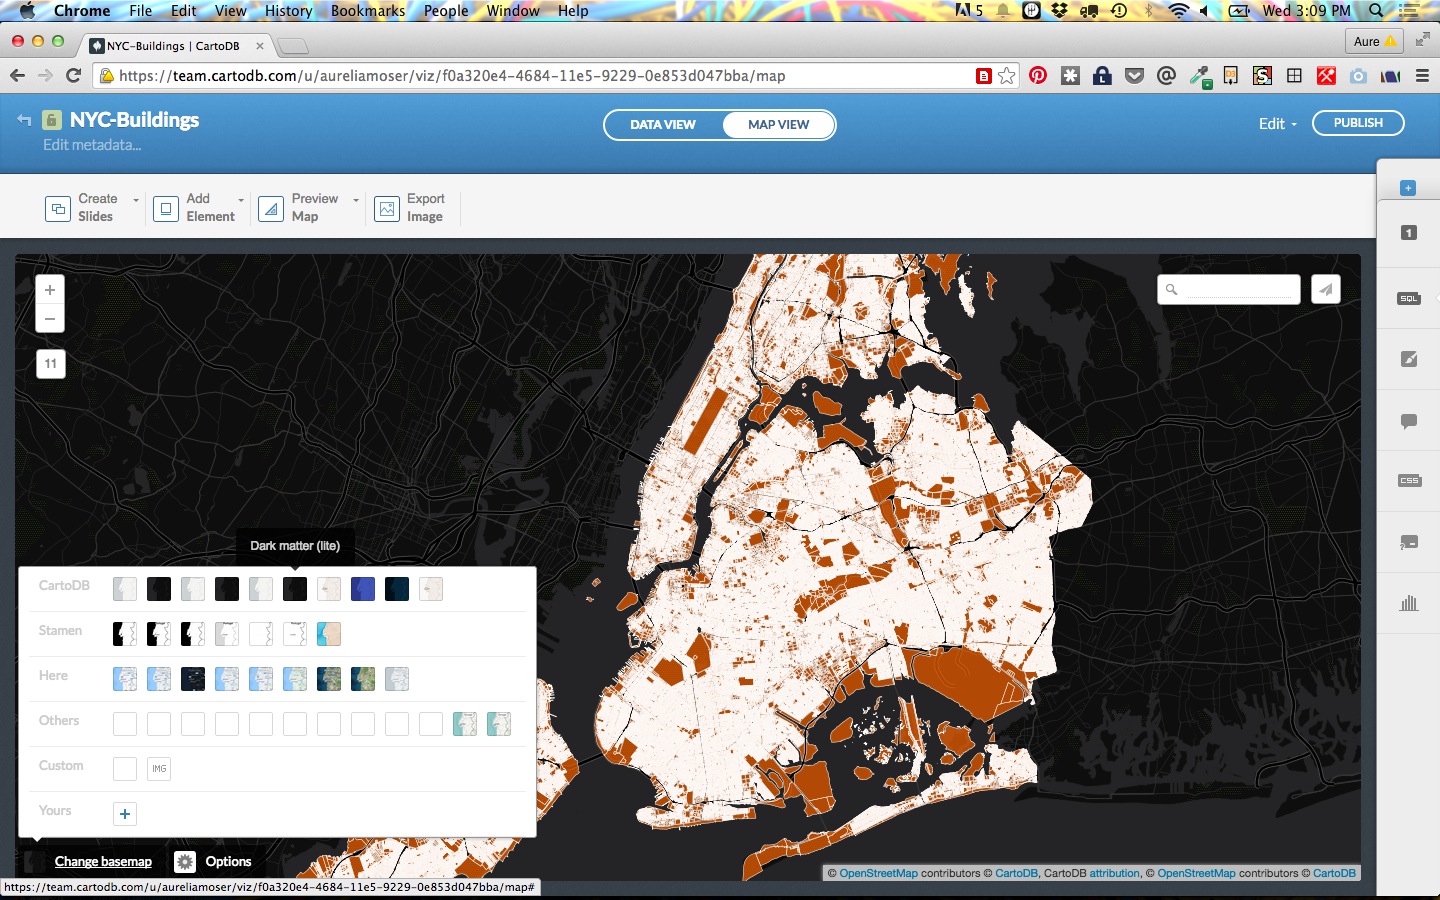
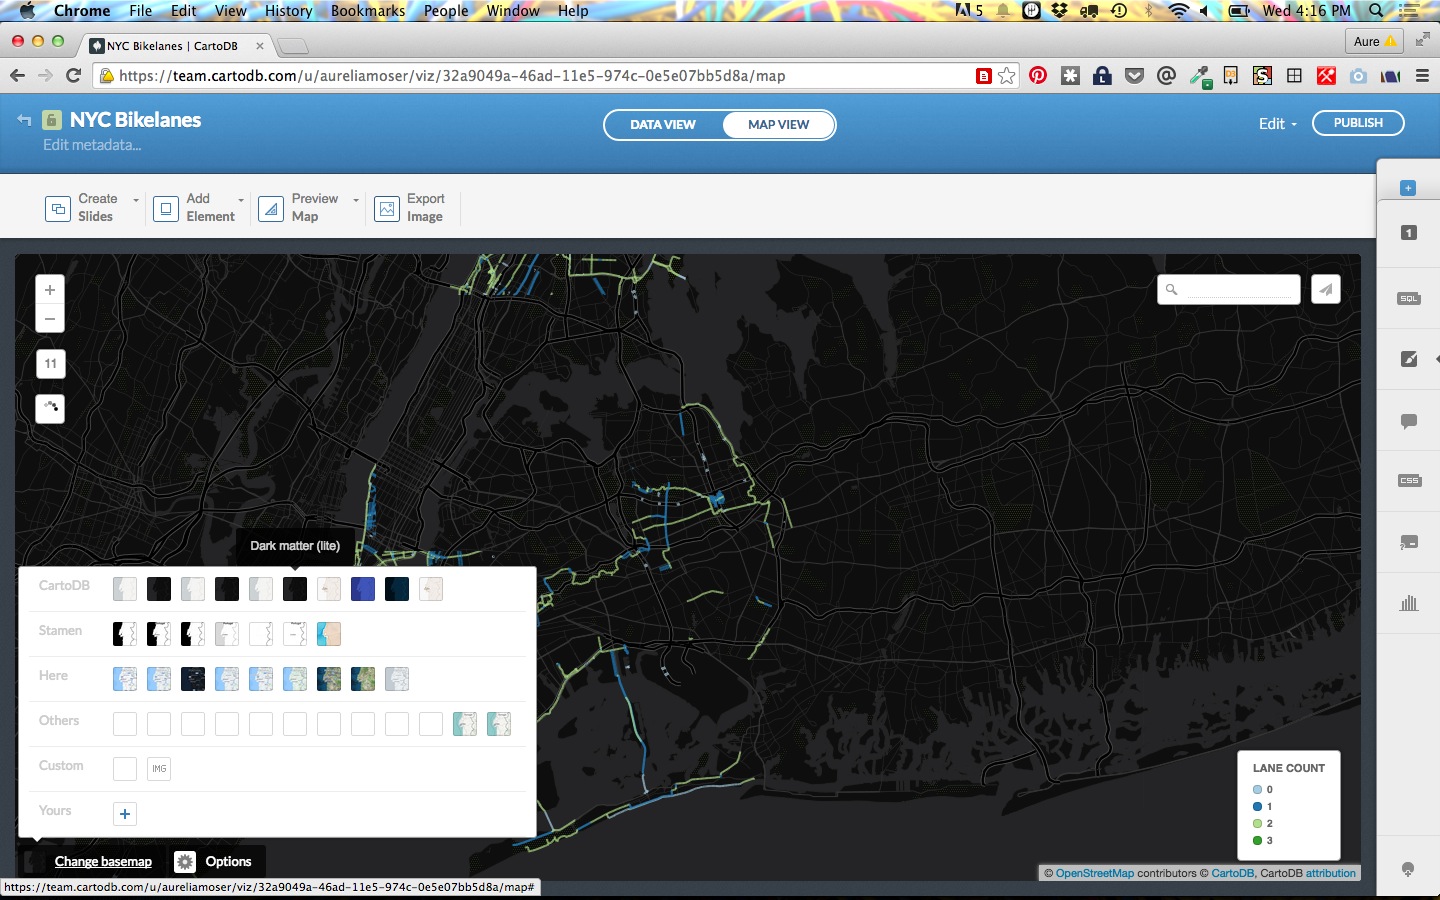
CHANGE YOUR BASEMAP
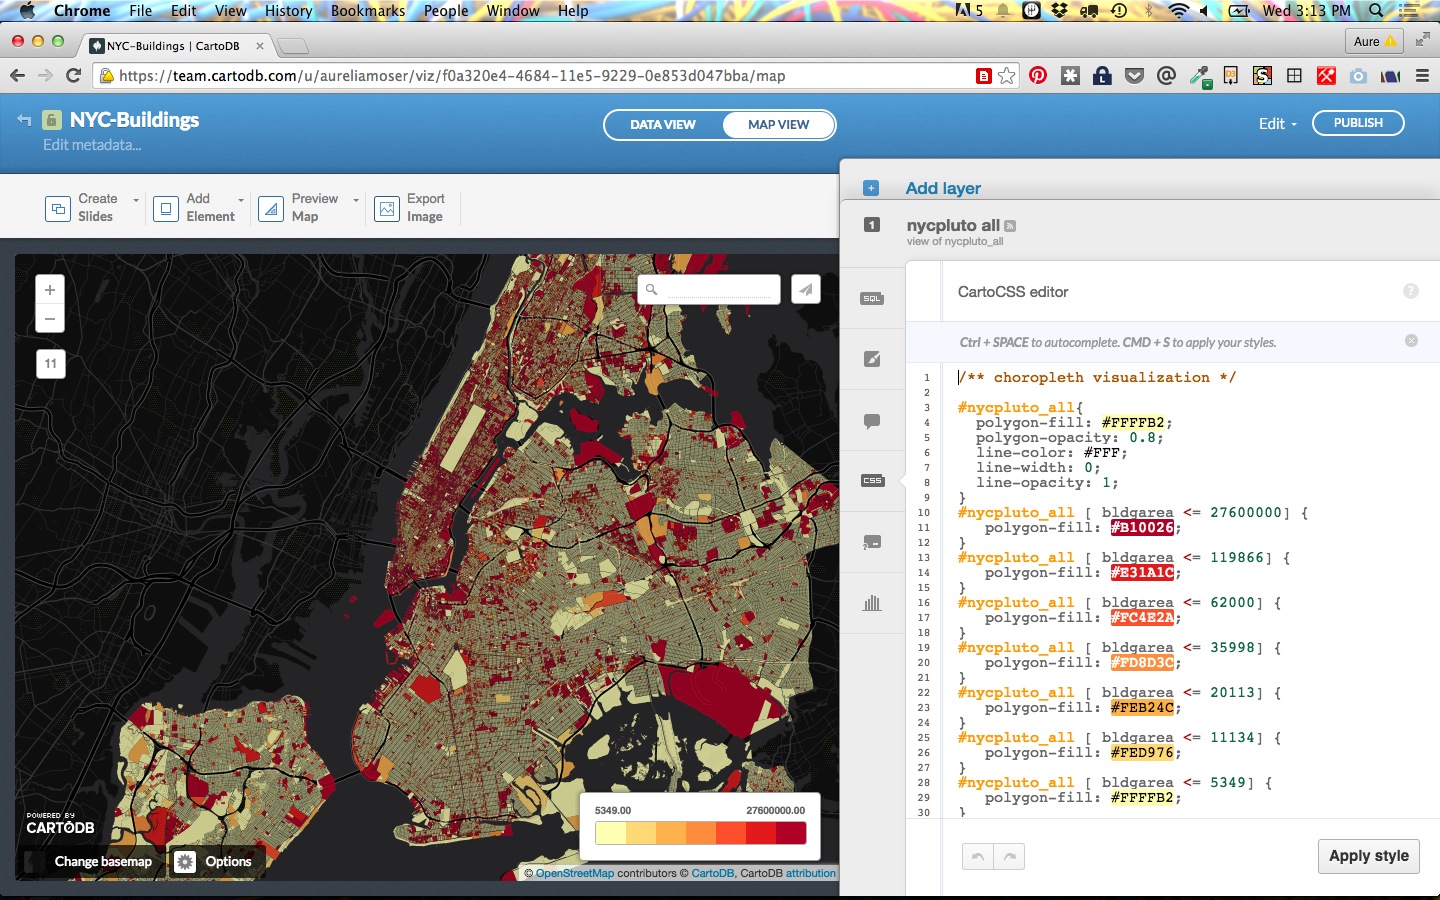
MAKE A CHOROPLETH IN THE WIZARD
STYLE IT WITH CARTOCSS
CREATE TOOLTIPS AND LEGENDS
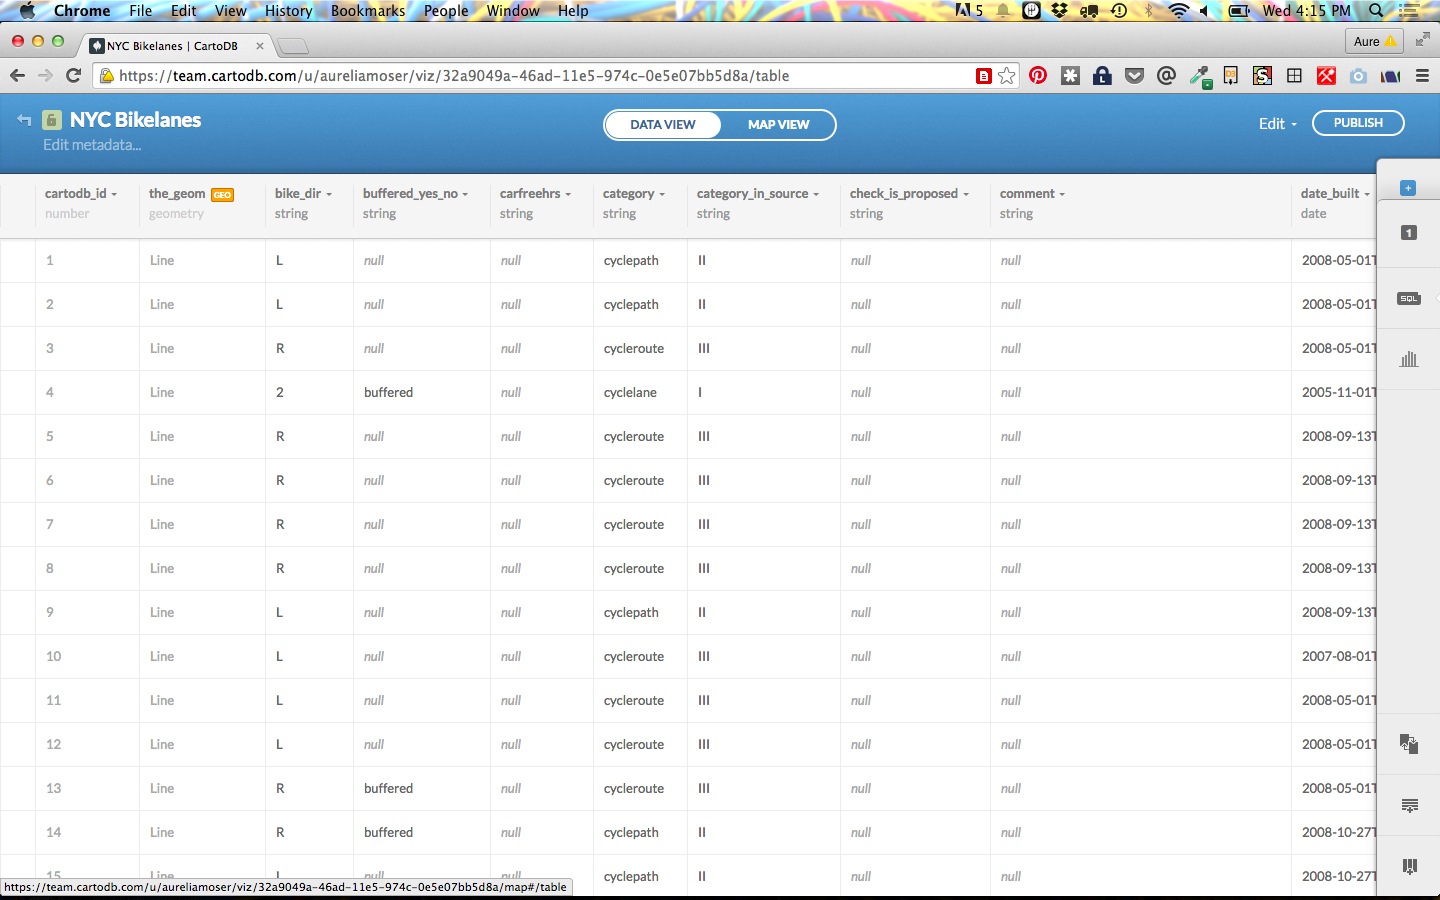
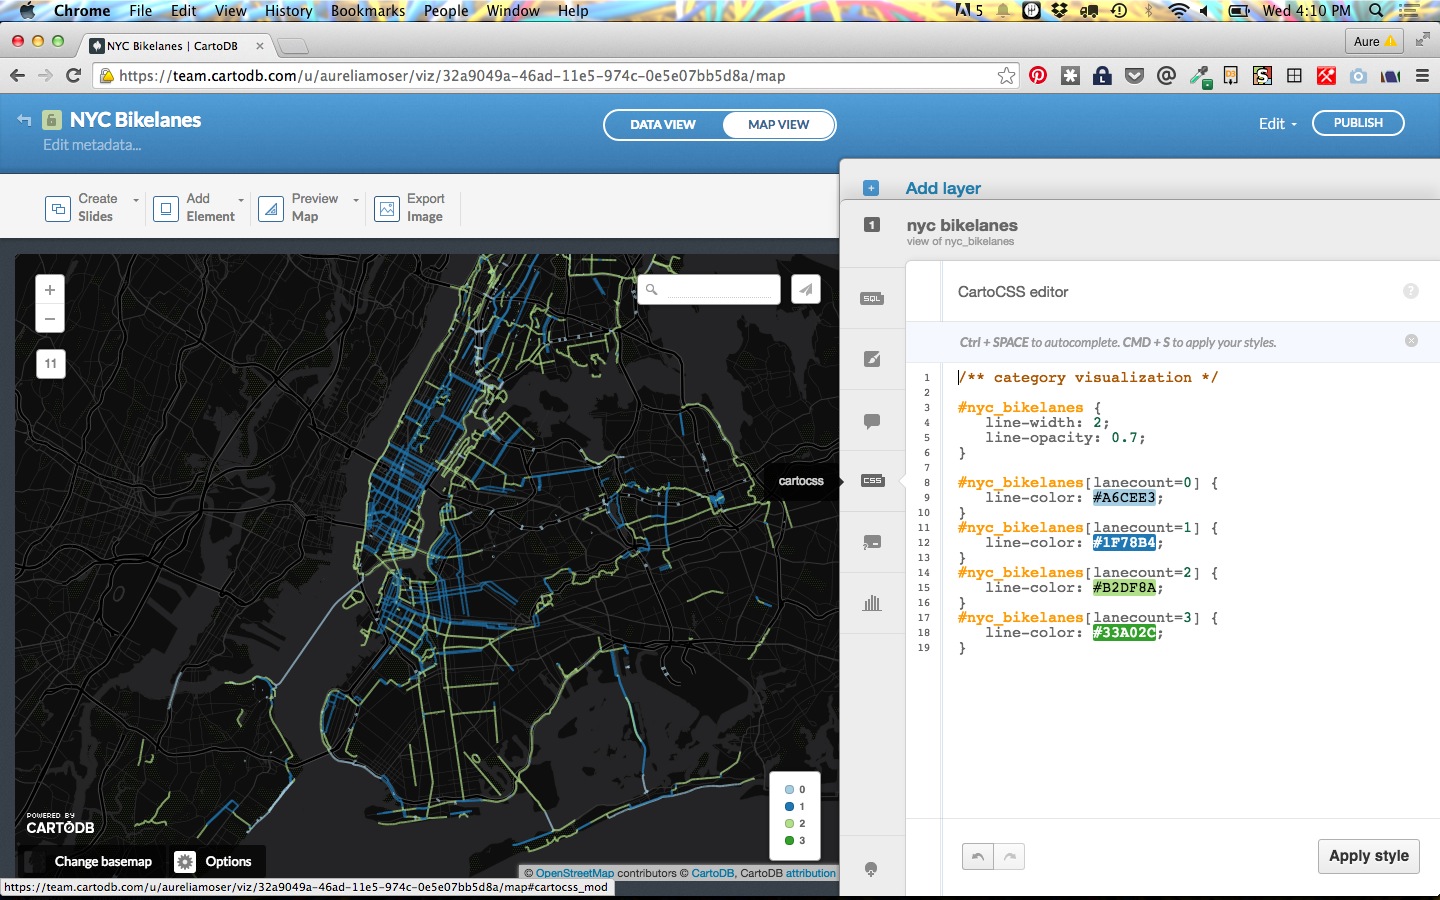
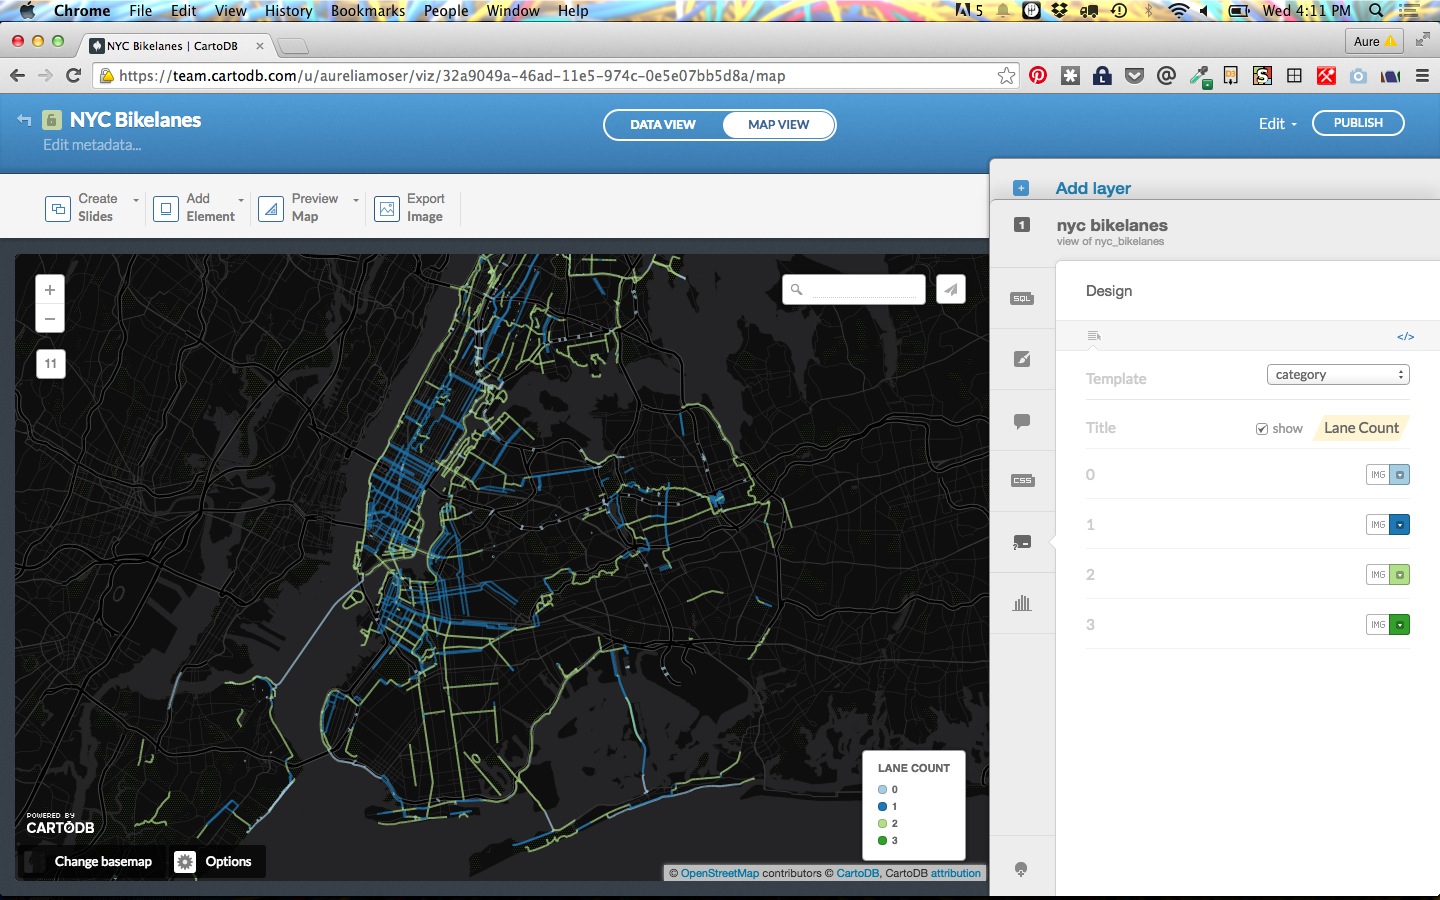
Case Study 2: NYC Bikelane Category Map
Let's try the Bikelane Data, making something like this.
- Go to the Workshop Repo
- Clone the repository to access the biklane data
- Upload it to CartoDB
EXPLORE THE DATA
CHANGE YOUR BASEMAP
MAKE A CATEGORY MAP IN THE WIZARD
STYLE IT WITH CARTOCSS
CREATE TOOLTIPS AND LEGENDS
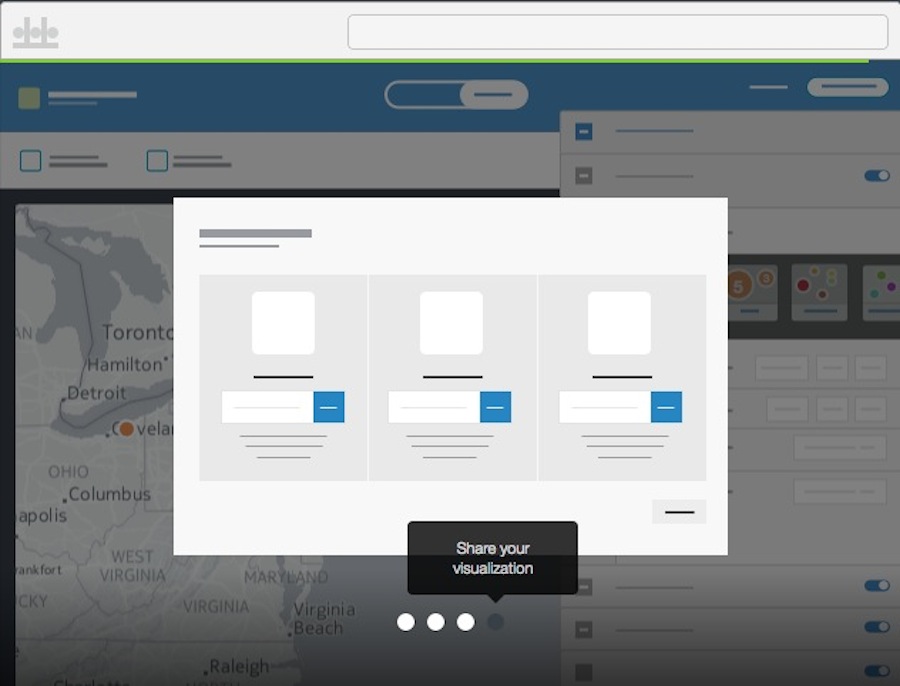
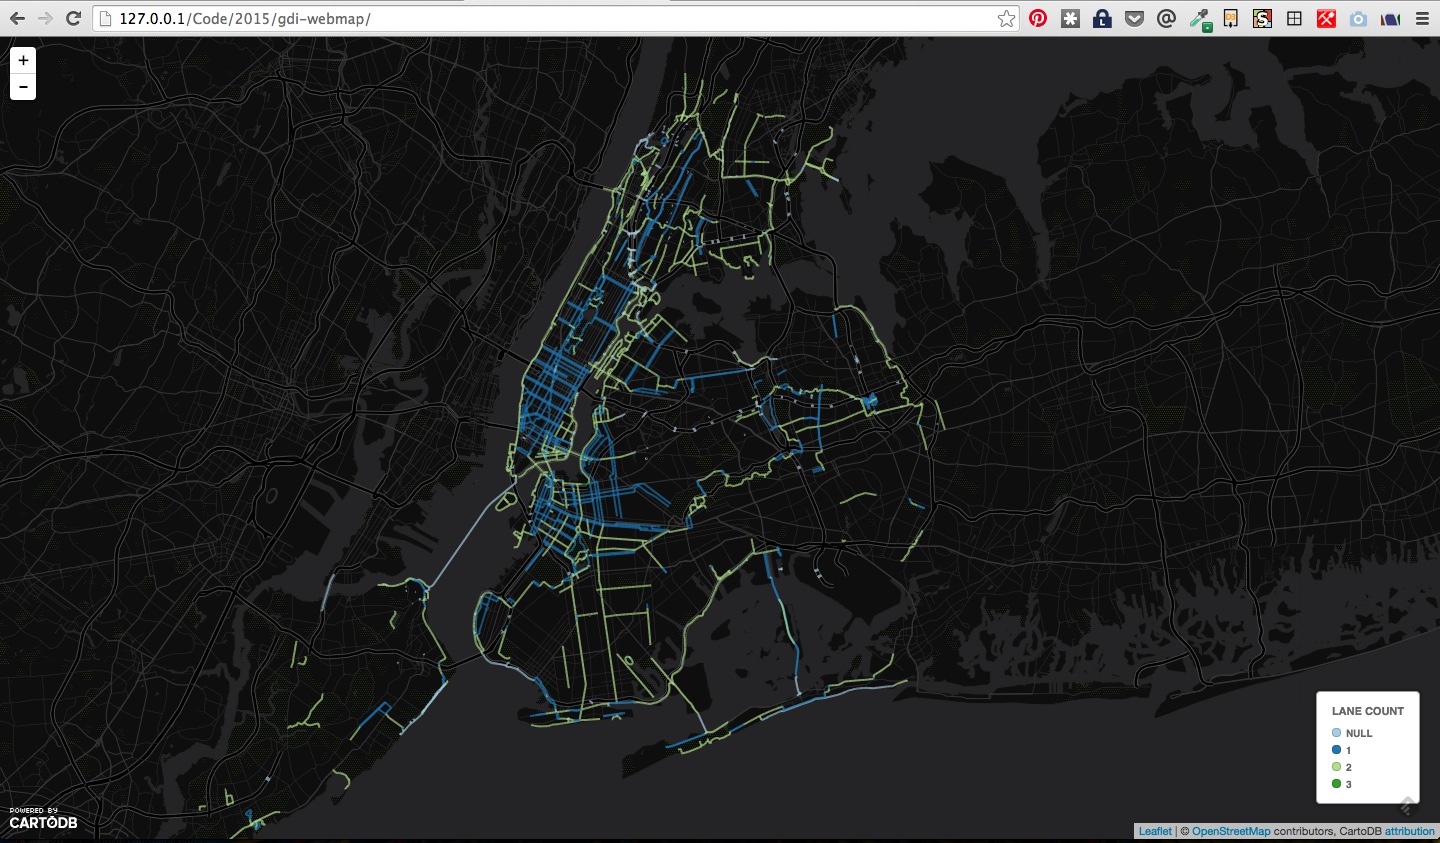
You can publish your map as is via the "Share" button in the interface, but if you would like to build a more custom version you can use the JS libraries and APIs mentioned above, and use CartoDB as your Data Store.
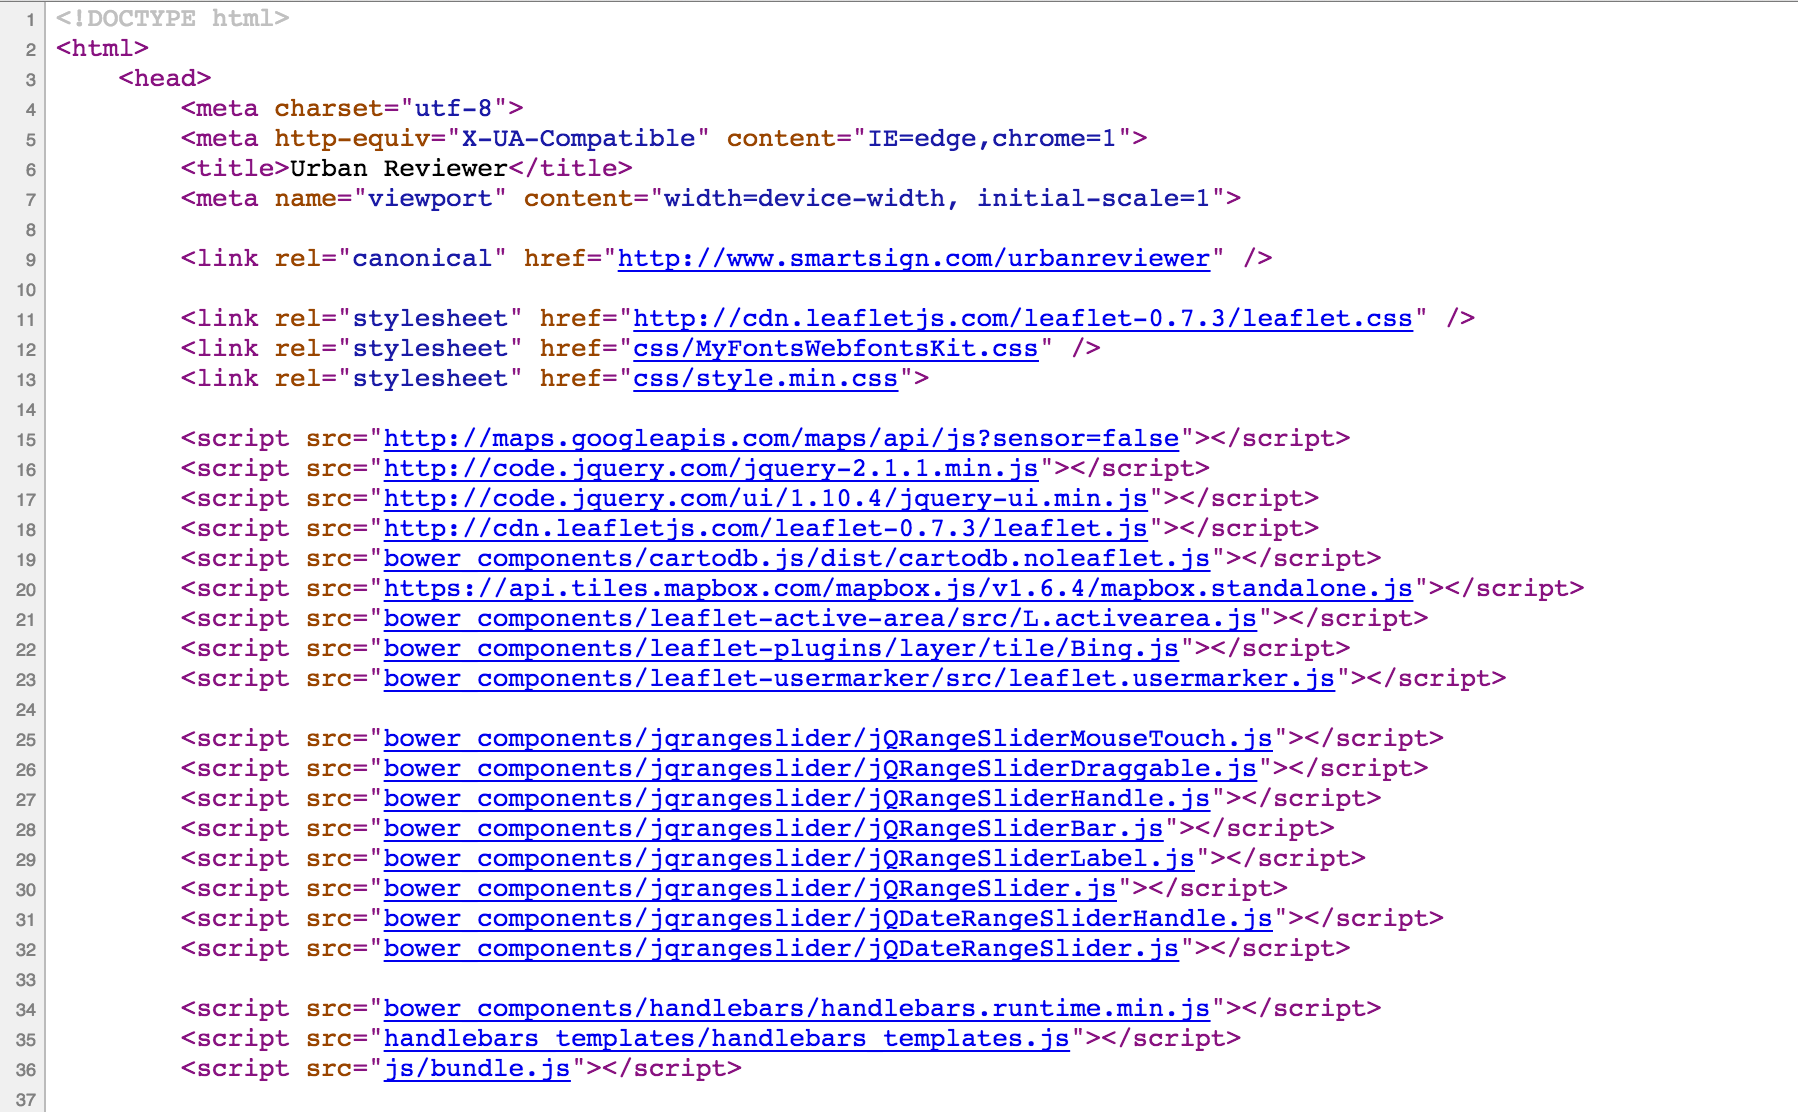
In the workshop repo, you'll find a template for making your map as a site online:
- index.html: setting up your map div and canvas
- main.js: pulling in your basemap, cartodb feature layers and other details
If you run this locally, you'll get a map that looks like this:
Here's an example of BikeData from Madrid modified with SQL and hosted on Github.
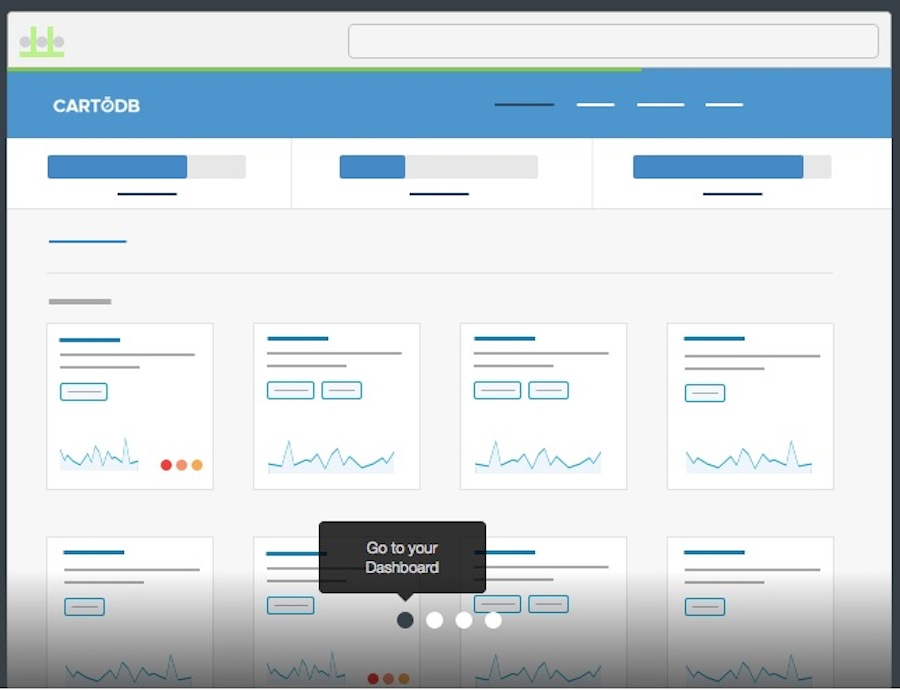
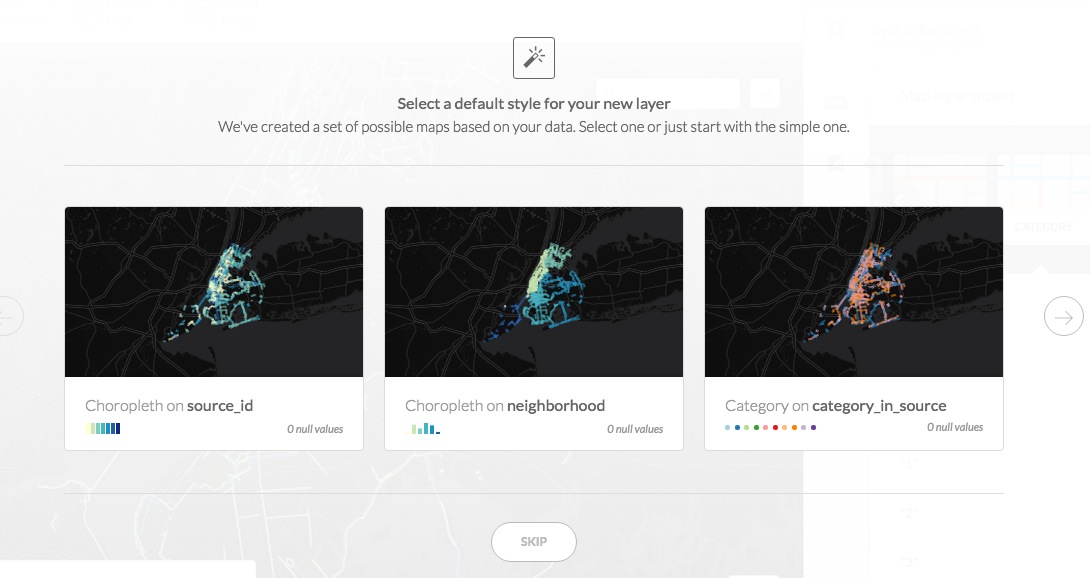
When you upload your data, Andy worked on a little tool to study your dataset and suggest "interesting maps" to you in the GUI, to aid in your exploration of the tool. It'll be a little modal in the lower left corner and will produce demo maps with pre-fab SQL and CSS like this:
Likewise, here's a demo of how to create selectors that reload data in CartoDB: http://bl.ocks.org/ohasselblad/e5e438b4e83a4c1d12e9
Cast Study 3: Multivariate Data Map App
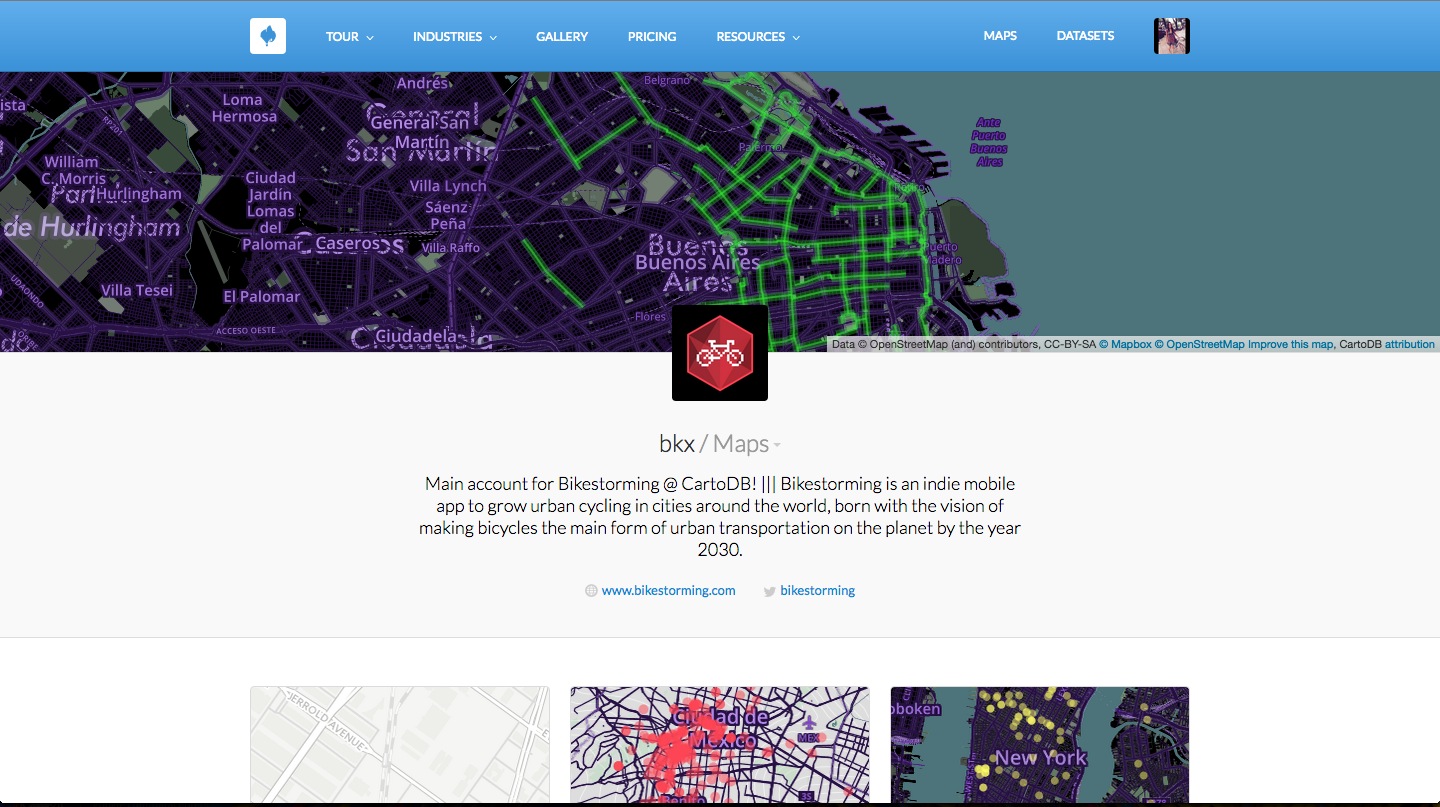
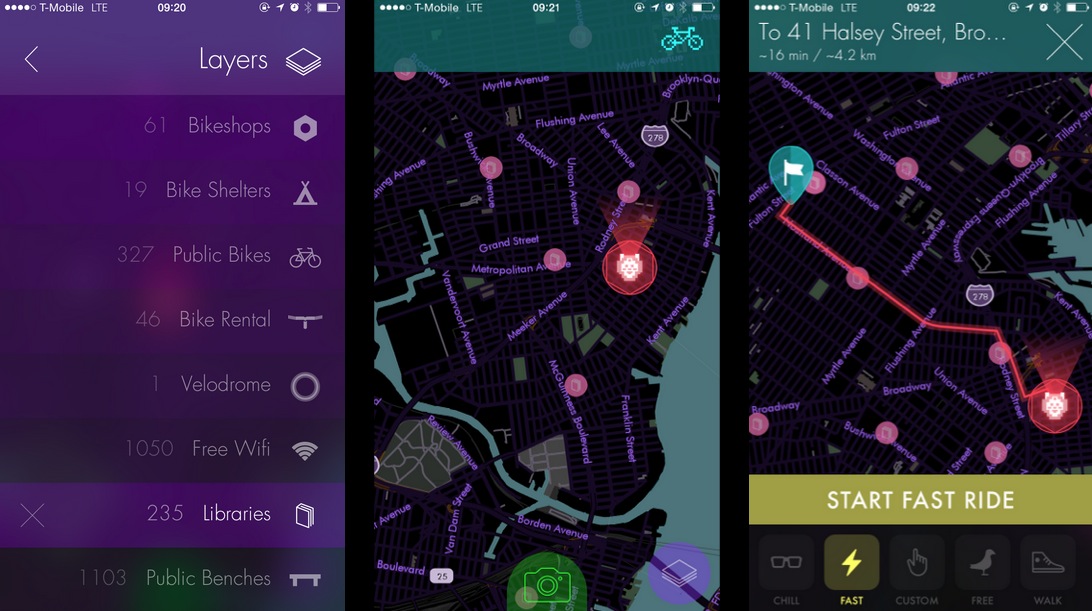
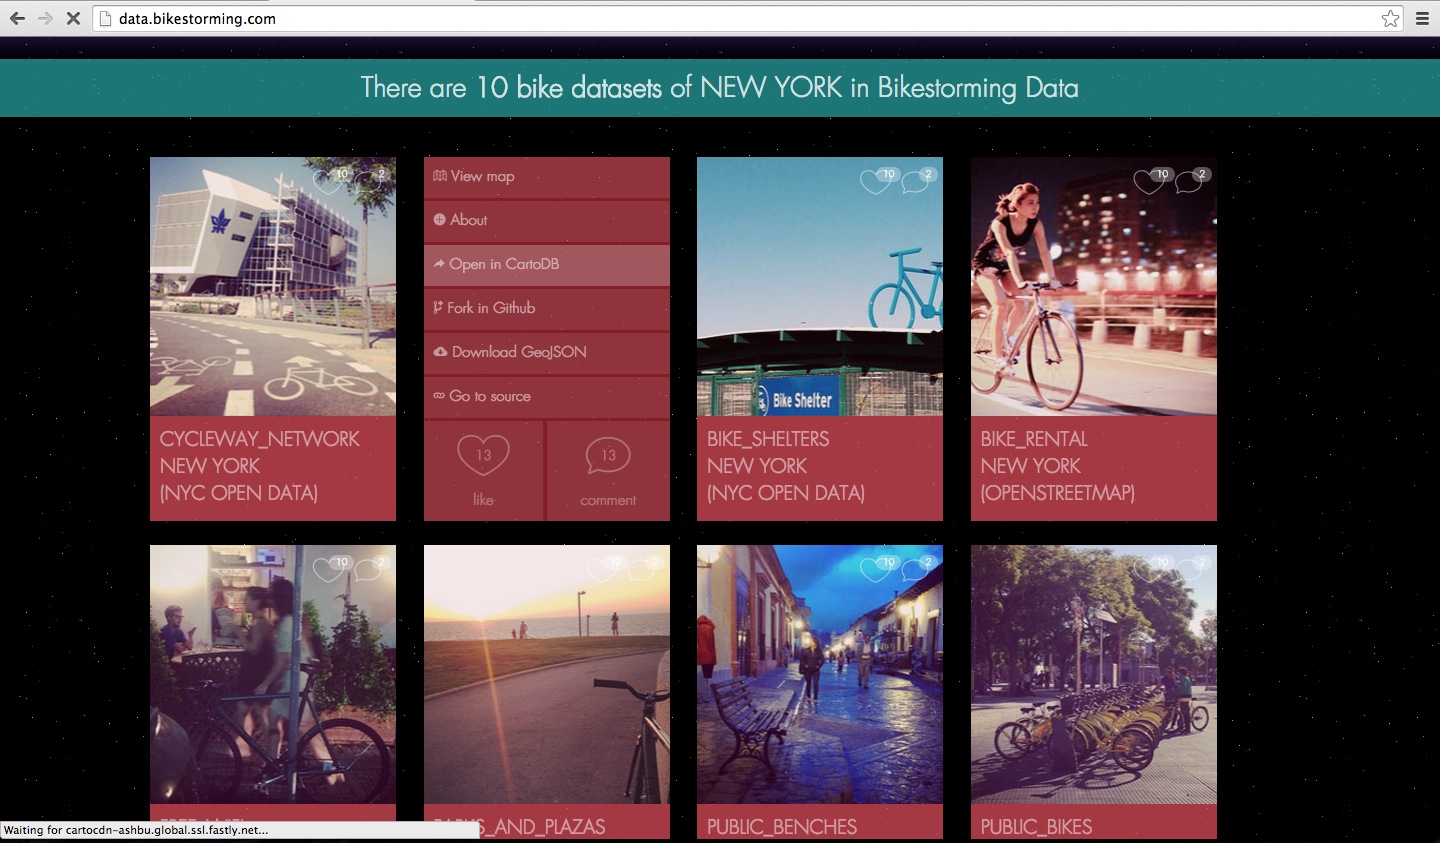
Bikestorming is a mobile app for urban cycling built with open data on CartoDB with MapBox Baselayers. They extract from public and social data sources to build both the iOS app and their open data portal for bike info.
Outside of the CartoJS library, we have others to help you build dynamic narrative with your data.
Maps that tell Time - Torque
Source: Traffic Change Data for SF Demo: Municipal Traffic in SF App Blog: CartoDB + Firebase
- Demonstrations in Brazil
- Animal migration patterns
- Diwali Celebrated
- Ramadan Tweets w/OdysseyJS
- Alcatraz Escapees
- Lynching and the Press
Maps that tell Stories - Odyssey JS
You can use CartoDB's SQL API to query your data and pull it into any charting library of your choosing.
You can easily wire up a chart of pollution data for example, set it as a sync table to update continuously, check the code here.
Learn more about it here!
Here are some examples:
| Type | Title | Link/Demo | BlogPost |
|---|---|---|---|
| Chart.js Bar Graph | Traffic Data | Aurelia's Block | |
| Highcharts | Sensor Data | Github / Demo | MOW Post |
| Highcharts | Weather Data | Aurelia's Block | Tutorial |
| Chart.js Line Graph | Tornado Data | Andrew's Block | |
| Plot.ly | Earthquake Data | Plotly Tutorial | CartoDB Blog |
- Map Academy
- CartoDB.js -- build a web app to visualize your data, allowing for user interaction
- SQL and PostGIS
- CartoDB Tutorials
- CartoDB Editor Documentation
- CartoDB APIs
- Community help on StackExchange
- CartoDB Map Gallery
- CartoDB Bootstrap Template by Chris Wong
- Charting Tools Repository
- Workshops @ CartoDB
- Recommended tools for Visualizations
- Perception Concerns
- Gestalt Theory
- Color Brewer or Geocolor
Please give us feedback on the workshop here! Whoot!
