Simple earcut 1.4 test of triangulation for polygons for webgl drawing.
Viedo of 250MB large geojson file:
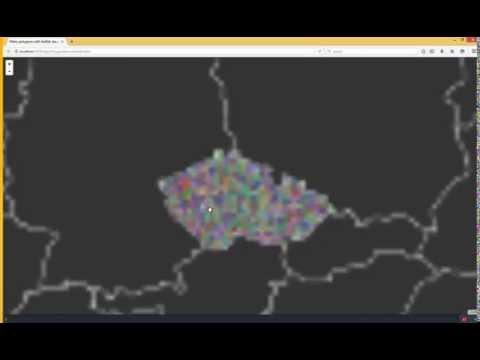
see discussion also here
| Licensed under MIT | |
| Copyright (c) 2015 Stanislav Sumbera, | |
| Permission is hereby granted, free of charge, to any person obtaining a copy of this software and associated documentation files | |
| (the "Software"), to deal in the Software without restriction, including without limitation the rights to use, | |
| copy, modify, merge, publish, distribute, sublicense, and/or sell copies of the Software, | |
| and to permit persons to whom the Software is furnished to do so, subject to the following conditions: | |
| The above copyright notice and this permission notice shall be included in all copies or substantial portions of the Software. | |
Simple earcut 1.4 test of triangulation for polygons for webgl drawing.
Viedo of 250MB large geojson file:
see discussion also here
| /* | |
| UPDATE July 2016 , moved and updated to here: https://github.com/Sumbera/gLayers.Leaflet | |
| Generic Canvas Overlay for leaflet, | |
| Stanislav Sumbera, April , 2014 | |
| - added userDrawFunc that is called when Canvas need to be redrawn | |
| - added few useful params fro userDrawFunc callback | |
| - fixed resize map bug | |
| inspired & portions taken from : https://github.com/Leaflet/Leaflet.heat |
| <!DOCTYPE html> | |
| <html> | |
| <head> | |
| <meta charset='utf-8' /> | |
| <title>WMS overlay with MabBox-gl-js (0.5.2)</title> | |
| <meta name='viewport' content='initial-scale=1,maximum-scale=1,user-scalable=no' /> | |
| <script src="http://www.sumbera.com/gist/js/mapbox/dist/mapbox-gl.js"></script> | |
| <link href="http://www.sumbera.com/gist/js/mapbox/dist/mapbox-gl.css" rel="stylesheet" /> | |
| <script src="http://www.sumbera.com/gist/js/mapbox/mbstyles/hybrid.js"></script> |
| /* | |
| Stanislav Sumbera, August , 2015 | |
| - scaled SVG draw prototype on top of Leaflet 1.0 beta | |
| - note it uses L.map patch to get it working right | |
| - SVG data are not modified, only scaled and optionaly radius/stroke width etc. can be specified on onScaleChange callback | |
| - very experimental | |
| */ | |
| //-- Patch to get leaflet properly zoomed |
| license: mit |
Testing SVG limits of plotting points on map using D3, Leaflet following this base sample: http://bost.ocks.org/mike/leaflet. However instead of scaling SVG in deep zooms, I am using Enter/Update/Exit pattern from D3 to dynamically update points on map. This has been prototyped also here http://bl.ocks.org/sumbera/9972460 with brushing of 100T points.
For zooming out (causing all points to be displayed), I am filtering out points that can't be effectively visible, thus reducing number of points in SVG. (check console for log output).
This sample is using real data of 24T coordinates, with this points are clustered around cities, rather than artifically randomized. Real number of rendered points / removed points can be seen in console.log
| <!doctype html> | |
| <html> | |
| <head> | |
| <title>Polyline tessellation test with Pixi.js</title> | |
| <meta charset="utf-8"> | |
| <style> | |
| html, body { | |
| height: 100%; | |
| padding: 0; |
| <!DOCTYPE html> | |
| <html xmlns="http://www.w3.org/1999/xhtml"> | |
| <head> | |
| <title>SVG default SVG in Leaflet 1.0</title> | |
| <link rel="stylesheet" href="http://www.sumbera.com/gist/js/leaflet/svg/scaled/leaflet.css" /> | |
| <style> | |
| body { | |
| margin: 0px; |