| Julia | CI |
|---|---|
| v1 | |
| nightly |
Advanced Unicode plotting library designed for use in Julia's REPL.
There are a couple of ways to generate typical plots without much verbosity. Here is a list of the main high-level functions for common scenarios:
- Scatterplot
- Lineplot
- Staircase Plot
- Barplot (horizontal)
- Histogram (horizontal)
- Boxplot (horizontal)
- Sparsity Pattern
- Density Plot
- Heatmap
Here is a quick hello world example of a typical use-case:
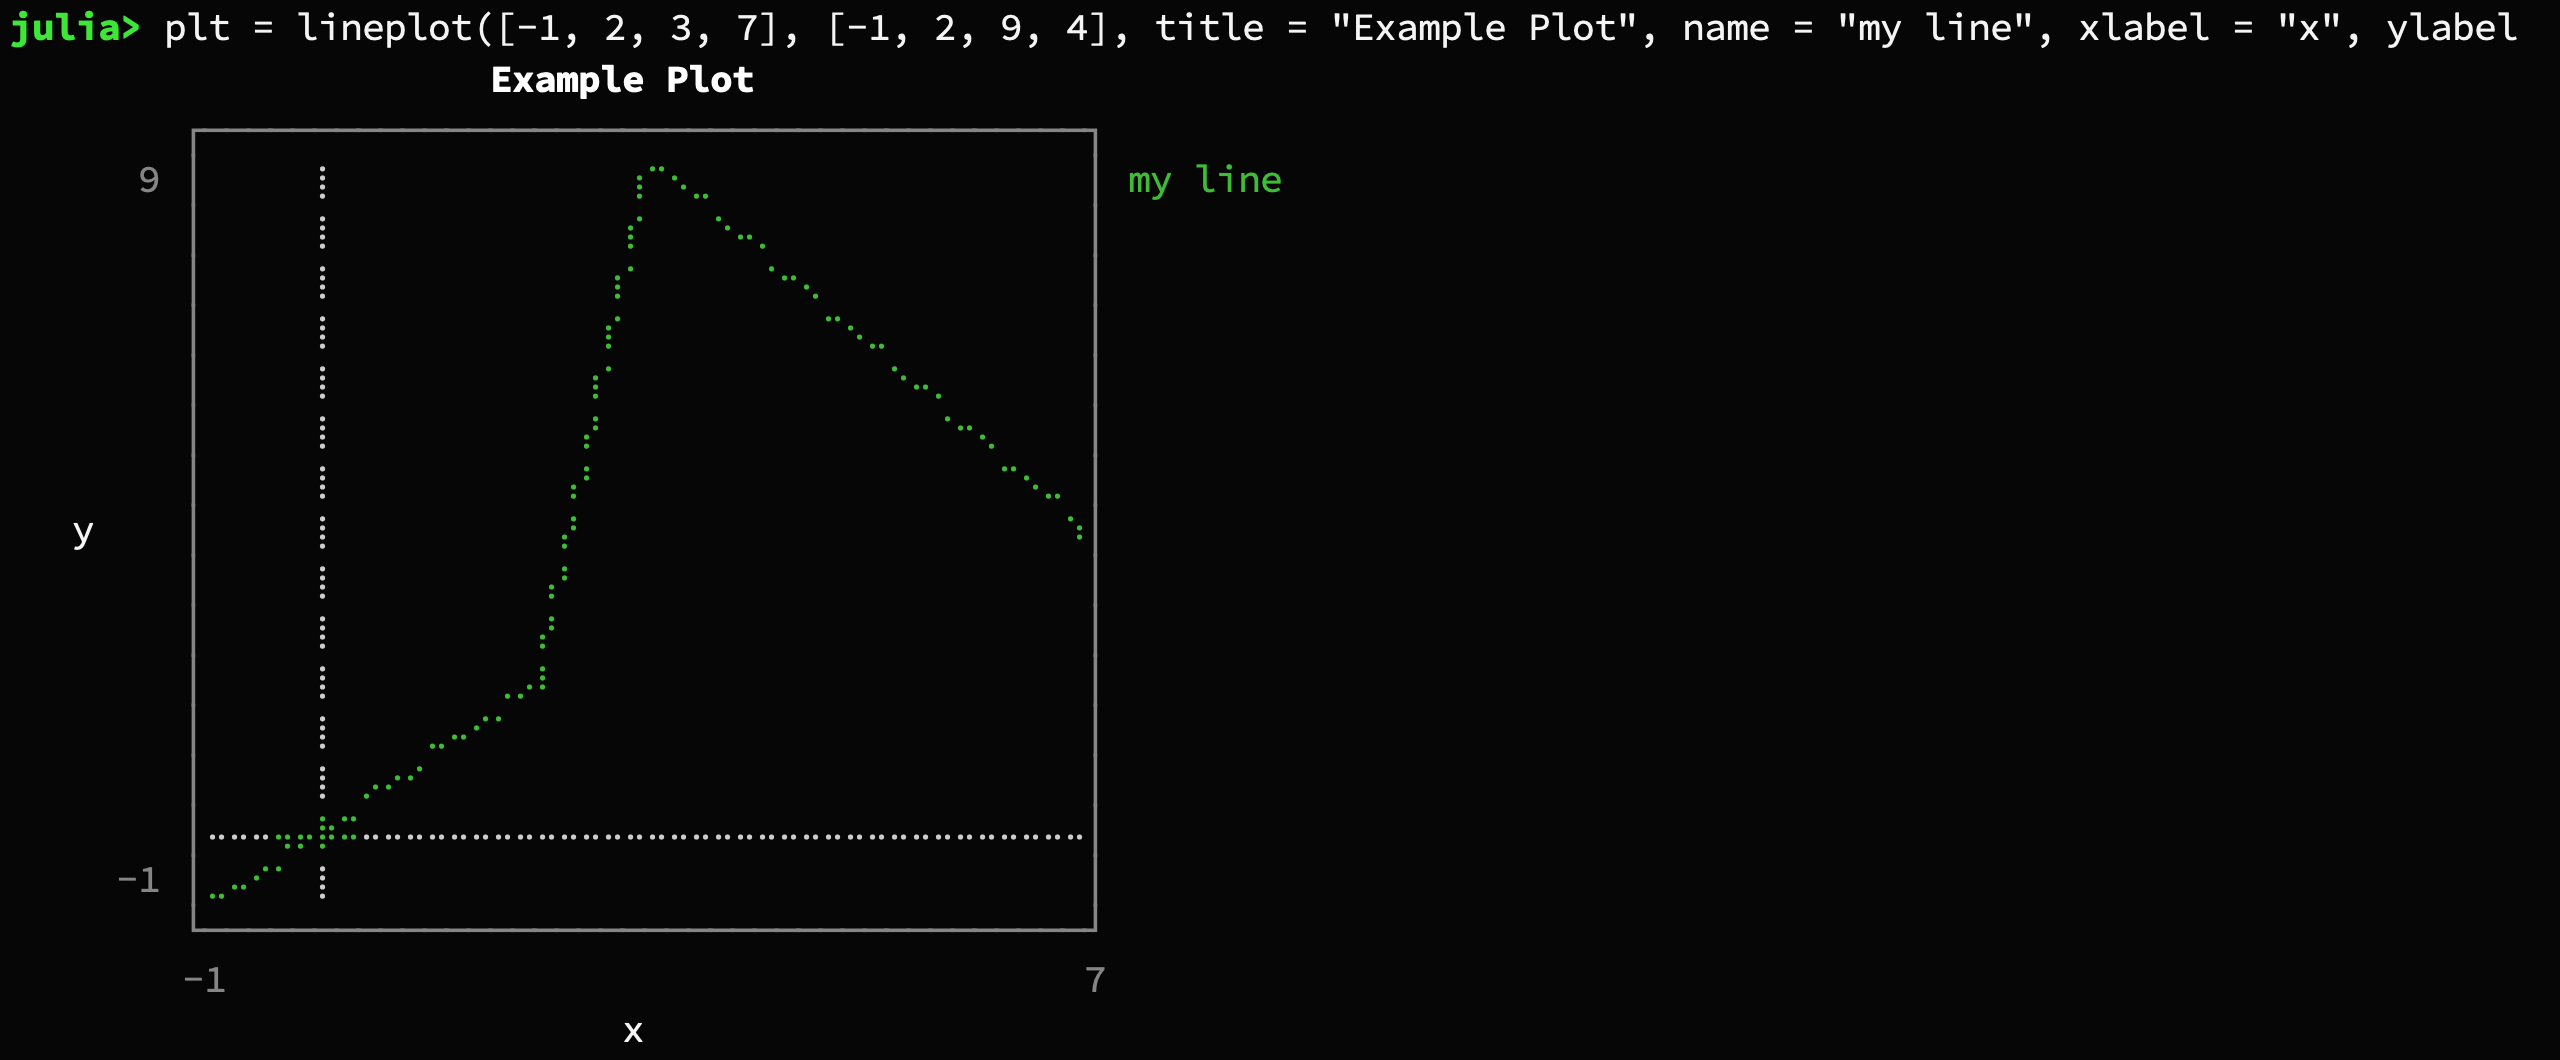
julia> using UnicodePlots
julia> plt = lineplot([-1, 2, 3, 7], [-1, 2, 9, 4], title = "Example Plot", name = "my line", xlabel = "x", ylabel = "y")

�[1m                      Example Plot�[22m
�[90m        ┌────────────────────────────────────────┐�[39m
      �[90m9�[39m�[90m │�[39m�[0m⠀�[0m⠀�[0m⠀�[0m⠀�[0m⠀�[0m⡇�[0m⠀�[0m⠀�[0m⠀�[0m⠀�[0m⠀�[0m⠀�[0m⠀�[0m⠀�[0m⠀�[0m⠀�[0m⠀�[0m⠀�[0m⠀�[38;5;2m⢰�[39m�[38;5;2m⠉�[39m�[38;5;2m⠢�[39m�[38;5;2m⣀�[39m�[0m⠀�[0m⠀�[0m⠀�[0m⠀�[0m⠀�[0m⠀�[0m⠀�[0m⠀�[0m⠀�[0m⠀�[0m⠀�[0m⠀�[0m⠀�[0m⠀�[0m⠀�[0m⠀�[0m⠀�[90m│�[39m �[32mmy line�[39m
       �[90m │�[39m�[0m⠀�[0m⠀�[0m⠀�[0m⠀�[0m⠀�[0m⡇�[0m⠀�[0m⠀�[0m⠀�[0m⠀�[0m⠀�[0m⠀�[0m⠀�[0m⠀�[0m⠀�[0m⠀�[0m⠀�[0m⠀�[0m⠀�[38;5;2m⡎�[39m�[0m⠀�[0m⠀�[0m⠀�[38;5;2m⠑�[39m�[38;5;2m⠤�[39m�[38;5;2m⡀�[39m�[0m⠀�[0m⠀�[0m⠀�[0m⠀�[0m⠀�[0m⠀�[0m⠀�[0m⠀�[0m⠀�[0m⠀�[0m⠀�[0m⠀�[0m⠀�[0m⠀�[90m│�[39m
       �[90m │�[39m�[0m⠀�[0m⠀�[0m⠀�[0m⠀�[0m⠀�[0m⡇�[0m⠀�[0m⠀�[0m⠀�[0m⠀�[0m⠀�[0m⠀�[0m⠀�[0m⠀�[0m⠀�[0m⠀�[0m⠀�[0m⠀�[38;5;2m⢰�[39m�[38;5;2m⠁�[39m�[0m⠀�[0m⠀�[0m⠀�[0m⠀�[0m⠀�[38;5;2m⠈�[39m�[38;5;2m⠒�[39m�[38;5;2m⢄�[39m�[0m⠀�[0m⠀�[0m⠀�[0m⠀�[0m⠀�[0m⠀�[0m⠀�[0m⠀�[0m⠀�[0m⠀�[0m⠀�[0m⠀�[90m│�[39m
       �[90m │�[39m�[0m⠀�[0m⠀�[0m⠀�[0m⠀�[0m⠀�[0m⡇�[0m⠀�[0m⠀�[0m⠀�[0m⠀�[0m⠀�[0m⠀�[0m⠀�[0m⠀�[0m⠀�[0m⠀�[0m⠀�[0m⠀�[38;5;2m⡎�[39m�[0m⠀�[0m⠀�[0m⠀�[0m⠀�[0m⠀�[0m⠀�[0m⠀�[0m⠀�[0m⠀�[38;5;2m⠉�[39m�[38;5;2m⠢�[39m�[38;5;2m⣀�[39m�[0m⠀�[0m⠀�[0m⠀�[0m⠀�[0m⠀�[0m⠀�[0m⠀�[0m⠀�[0m⠀�[90m│�[39m
       �[90m │�[39m�[0m⠀�[0m⠀�[0m⠀�[0m⠀�[0m⠀�[0m⡇�[0m⠀�[0m⠀�[0m⠀�[0m⠀�[0m⠀�[0m⠀�[0m⠀�[0m⠀�[0m⠀�[0m⠀�[0m⠀�[38;5;2m⢰�[39m�[38;5;2m⠁�[39m�[0m⠀�[0m⠀�[0m⠀�[0m⠀�[0m⠀�[0m⠀�[0m⠀�[0m⠀�[0m⠀�[0m⠀�[0m⠀�[0m⠀�[38;5;2m⠑�[39m�[38;5;2m⠤�[39m�[38;5;2m⡀�[39m�[0m⠀�[0m⠀�[0m⠀�[0m⠀�[0m⠀�[0m⠀�[90m│�[39m
       �[90m │�[39m�[0m⠀�[0m⠀�[0m⠀�[0m⠀�[0m⠀�[0m⡇�[0m⠀�[0m⠀�[0m⠀�[0m⠀�[0m⠀�[0m⠀�[0m⠀�[0m⠀�[0m⠀�[0m⠀�[0m⠀�[38;5;2m⡜�[39m�[0m⠀�[0m⠀�[0m⠀�[0m⠀�[0m⠀�[0m⠀�[0m⠀�[0m⠀�[0m⠀�[0m⠀�[0m⠀�[0m⠀�[0m⠀�[0m⠀�[0m⠀�[38;5;2m⠈�[39m�[38;5;2m⠒�[39m�[38;5;2m⢄�[39m�[0m⠀�[0m⠀�[0m⠀�[0m⠀�[90m│�[39m
       �[90m │�[39m�[0m⠀�[0m⠀�[0m⠀�[0m⠀�[0m⠀�[0m⡇�[0m⠀�[0m⠀�[0m⠀�[0m⠀�[0m⠀�[0m⠀�[0m⠀�[0m⠀�[0m⠀�[0m⠀�[38;5;2m⢠�[39m�[38;5;2m⠃�[39m�[0m⠀�[0m⠀�[0m⠀�[0m⠀�[0m⠀�[0m⠀�[0m⠀�[0m⠀�[0m⠀�[0m⠀�[0m⠀�[0m⠀�[0m⠀�[0m⠀�[0m⠀�[0m⠀�[0m⠀�[0m⠀�[38;5;2m⠉�[39m�[38;5;2m⠢�[39m�[38;5;2m⣀�[39m�[0m⠀�[90m│�[39m
   �[0my   �[90m │�[39m�[0m⠀�[0m⠀�[0m⠀�[0m⠀�[0m⠀�[0m⡇�[0m⠀�[0m⠀�[0m⠀�[0m⠀�[0m⠀�[0m⠀�[0m⠀�[0m⠀�[0m⠀�[0m⠀�[38;5;2m⡜�[39m�[0m⠀�[0m⠀�[0m⠀�[0m⠀�[0m⠀�[0m⠀�[0m⠀�[0m⠀�[0m⠀�[0m⠀�[0m⠀�[0m⠀�[0m⠀�[0m⠀�[0m⠀�[0m⠀�[0m⠀�[0m⠀�[0m⠀�[0m⠀�[0m⠀�[0m⠀�[38;5;2m⠱�[39m�[90m│�[39m
       �[90m │�[39m�[0m⠀�[0m⠀�[0m⠀�[0m⠀�[0m⠀�[0m⡇�[0m⠀�[0m⠀�[0m⠀�[0m⠀�[0m⠀�[0m⠀�[0m⠀�[0m⠀�[0m⠀�[38;5;2m⢠�[39m�[38;5;2m⠃�[39m�[0m⠀�[0m⠀�[0m⠀�[0m⠀�[0m⠀�[0m⠀�[0m⠀�[0m⠀�[0m⠀�[0m⠀�[0m⠀�[0m⠀�[0m⠀�[0m⠀�[0m⠀�[0m⠀�[0m⠀�[0m⠀�[0m⠀�[0m⠀�[0m⠀�[0m⠀�[0m⠀�[90m│�[39m
       �[90m │�[39m�[0m⠀�[0m⠀�[0m⠀�[0m⠀�[0m⠀�[0m⡇�[0m⠀�[0m⠀�[0m⠀�[0m⠀�[0m⠀�[0m⠀�[0m⠀�[0m⠀�[0m⠀�[38;5;2m⡜�[39m�[0m⠀�[0m⠀�[0m⠀�[0m⠀�[0m⠀�[0m⠀�[0m⠀�[0m⠀�[0m⠀�[0m⠀�[0m⠀�[0m⠀�[0m⠀�[0m⠀�[0m⠀�[0m⠀�[0m⠀�[0m⠀�[0m⠀�[0m⠀�[0m⠀�[0m⠀�[0m⠀�[0m⠀�[90m│�[39m
       �[90m │�[39m�[0m⠀�[0m⠀�[0m⠀�[0m⠀�[0m⠀�[0m⡇�[0m⠀�[0m⠀�[0m⠀�[0m⠀�[0m⠀�[0m⠀�[0m⠀�[38;5;2m⢀�[39m�[38;5;2m⡠�[39m�[38;5;2m⠇�[39m�[0m⠀�[0m⠀�[0m⠀�[0m⠀�[0m⠀�[0m⠀�[0m⠀�[0m⠀�[0m⠀�[0m⠀�[0m⠀�[0m⠀�[0m⠀�[0m⠀�[0m⠀�[0m⠀�[0m⠀�[0m⠀�[0m⠀�[0m⠀�[0m⠀�[0m⠀�[0m⠀�[0m⠀�[90m│�[39m
       �[90m │�[39m�[0m⠀�[0m⠀�[0m⠀�[0m⠀�[0m⠀�[0m⡇�[0m⠀�[0m⠀�[0m⠀�[0m⠀�[38;5;2m⣀�[39m�[38;5;2m⠤�[39m�[38;5;2m⠊�[39m�[38;5;2m⠁�[39m�[0m⠀�[0m⠀�[0m⠀�[0m⠀�[0m⠀�[0m⠀�[0m⠀�[0m⠀�[0m⠀�[0m⠀�[0m⠀�[0m⠀�[0m⠀�[0m⠀�[0m⠀�[0m⠀�[0m⠀�[0m⠀�[0m⠀�[0m⠀�[0m⠀�[0m⠀�[0m⠀�[0m⠀�[0m⠀�[0m⠀�[90m│�[39m
       �[90m │�[39m�[0m⠀�[0m⠀�[0m⠀�[0m⠀�[0m⠀�[0m⡇�[0m⠀�[38;5;2m⡠�[39m�[38;5;2m⠔�[39m�[38;5;2m⠊�[39m�[0m⠀�[0m⠀�[0m⠀�[0m⠀�[0m⠀�[0m⠀�[0m⠀�[0m⠀�[0m⠀�[0m⠀�[0m⠀�[0m⠀�[0m⠀�[0m⠀�[0m⠀�[0m⠀�[0m⠀�[0m⠀�[0m⠀�[0m⠀�[0m⠀�[0m⠀�[0m⠀�[0m⠀�[0m⠀�[0m⠀�[0m⠀�[0m⠀�[0m⠀�[0m⠀�[90m│�[39m
       �[90m │�[39m�[0m⠤�[0m⠤�[0m⠤�[38;5;2m⢤�[39m�[38;5;2m⡤�[39m�[38;5;2m⡷�[39m�[38;5;2m⠭�[39m�[0m⠤�[0m⠤�[0m⠤�[0m⠤�[0m⠤�[0m⠤�[0m⠤�[0m⠤�[0m⠤�[0m⠤�[0m⠤�[0m⠤�[0m⠤�[0m⠤�[0m⠤�[0m⠤�[0m⠤�[0m⠤�[0m⠤�[0m⠤�[0m⠤�[0m⠤�[0m⠤�[0m⠤�[0m⠤�[0m⠤�[0m⠤�[0m⠤�[0m⠤�[0m⠤�[0m⠤�[0m⠤�[0m⠤�[90m│�[39m
     �[90m-1�[39m�[90m │�[39m�[38;5;2m⣀�[39m�[38;5;2m⠤�[39m�[38;5;2m⠊�[39m�[38;5;2m⠁�[39m�[0m⠀�[0m⡇�[0m⠀�[0m⠀�[0m⠀�[0m⠀�[0m⠀�[0m⠀�[0m⠀�[0m⠀�[0m⠀�[0m⠀�[0m⠀�[0m⠀�[0m⠀�[0m⠀�[0m⠀�[0m⠀�[0m⠀�[0m⠀�[0m⠀�[0m⠀�[0m⠀�[0m⠀�[0m⠀�[0m⠀�[0m⠀�[0m⠀�[0m⠀�[0m⠀�[0m⠀�[0m⠀�[0m⠀�[0m⠀�[0m⠀�[0m⠀�[90m│�[39m
�[90m        └────────────────────────────────────────┘�[39m
�[90m        -1�[39m�[90m                  �[39m�[90m                     7�[39m
�[0m                            x

                      Example Plot
        ┌────────────────────────────────────────┐
      9 │⠀⠀⠀⠀⠀⡇⠀⠀⠀⠀⠀⠀⠀⠀⠀⠀⠀⠀⠀⢰⠉⠢⣀⠀⠀⠀⠀⠀⠀⠀⠀⠀⠀⠀⠀⠀⠀⠀⠀⠀│ my line
        │⠀⠀⠀⠀⠀⡇⠀⠀⠀⠀⠀⠀⠀⠀⠀⠀⠀⠀⠀⡎⠀⠀⠀⠑⠤⡀⠀⠀⠀⠀⠀⠀⠀⠀⠀⠀⠀⠀⠀⠀│
        │⠀⠀⠀⠀⠀⡇⠀⠀⠀⠀⠀⠀⠀⠀⠀⠀⠀⠀⢰⠁⠀⠀⠀⠀⠀⠈⠒⢄⠀⠀⠀⠀⠀⠀⠀⠀⠀⠀⠀⠀│
        │⠀⠀⠀⠀⠀⡇⠀⠀⠀⠀⠀⠀⠀⠀⠀⠀⠀⠀⡎⠀⠀⠀⠀⠀⠀⠀⠀⠀⠉⠢⣀⠀⠀⠀⠀⠀⠀⠀⠀⠀│
        │⠀⠀⠀⠀⠀⡇⠀⠀⠀⠀⠀⠀⠀⠀⠀⠀⠀⢰⠁⠀⠀⠀⠀⠀⠀⠀⠀⠀⠀⠀⠀⠑⠤⡀⠀⠀⠀⠀⠀⠀│
        │⠀⠀⠀⠀⠀⡇⠀⠀⠀⠀⠀⠀⠀⠀⠀⠀⠀⡜⠀⠀⠀⠀⠀⠀⠀⠀⠀⠀⠀⠀⠀⠀⠀⠈⠒⢄⠀⠀⠀⠀│
        │⠀⠀⠀⠀⠀⡇⠀⠀⠀⠀⠀⠀⠀⠀⠀⠀⢠⠃⠀⠀⠀⠀⠀⠀⠀⠀⠀⠀⠀⠀⠀⠀⠀⠀⠀⠀⠉⠢⣀⠀│
   y    │⠀⠀⠀⠀⠀⡇⠀⠀⠀⠀⠀⠀⠀⠀⠀⠀⡜⠀⠀⠀⠀⠀⠀⠀⠀⠀⠀⠀⠀⠀⠀⠀⠀⠀⠀⠀⠀⠀⠀⠱│
        │⠀⠀⠀⠀⠀⡇⠀⠀⠀⠀⠀⠀⠀⠀⠀⢠⠃⠀⠀⠀⠀⠀⠀⠀⠀⠀⠀⠀⠀⠀⠀⠀⠀⠀⠀⠀⠀⠀⠀⠀│
        │⠀⠀⠀⠀⠀⡇⠀⠀⠀⠀⠀⠀⠀⠀⠀⡜⠀⠀⠀⠀⠀⠀⠀⠀⠀⠀⠀⠀⠀⠀⠀⠀⠀⠀⠀⠀⠀⠀⠀⠀│
        │⠀⠀⠀⠀⠀⡇⠀⠀⠀⠀⠀⠀⠀⢀⡠⠇⠀⠀⠀⠀⠀⠀⠀⠀⠀⠀⠀⠀⠀⠀⠀⠀⠀⠀⠀⠀⠀⠀⠀⠀│
        │⠀⠀⠀⠀⠀⡇⠀⠀⠀⠀⣀⠤⠊⠁⠀⠀⠀⠀⠀⠀⠀⠀⠀⠀⠀⠀⠀⠀⠀⠀⠀⠀⠀⠀⠀⠀⠀⠀⠀⠀│
        │⠀⠀⠀⠀⠀⡇⠀⡠⠔⠊⠀⠀⠀⠀⠀⠀⠀⠀⠀⠀⠀⠀⠀⠀⠀⠀⠀⠀⠀⠀⠀⠀⠀⠀⠀⠀⠀⠀⠀⠀│
        │⠤⠤⠤⢤⡤⡷⠭⠤⠤⠤⠤⠤⠤⠤⠤⠤⠤⠤⠤⠤⠤⠤⠤⠤⠤⠤⠤⠤⠤⠤⠤⠤⠤⠤⠤⠤⠤⠤⠤⠤│
     -1 │⣀⠤⠊⠁⠀⡇⠀⠀⠀⠀⠀⠀⠀⠀⠀⠀⠀⠀⠀⠀⠀⠀⠀⠀⠀⠀⠀⠀⠀⠀⠀⠀⠀⠀⠀⠀⠀⠀⠀⠀│
        └────────────────────────────────────────┘
        -1                                       7
                            x
There are other types of Canvas available (see section
"Low-level Interface"). In some situations, such as printing to
a file, using AsciiCanvas, DotCanvas or BlockCanvas might
lead to better results.
lineplot([-1, 2, 3, 7], [-1, 2, 9, 4], title = "Example Plot", name = "my line", xlabel = "x", ylabel = "y", canvas = DotCanvas, border = :ascii)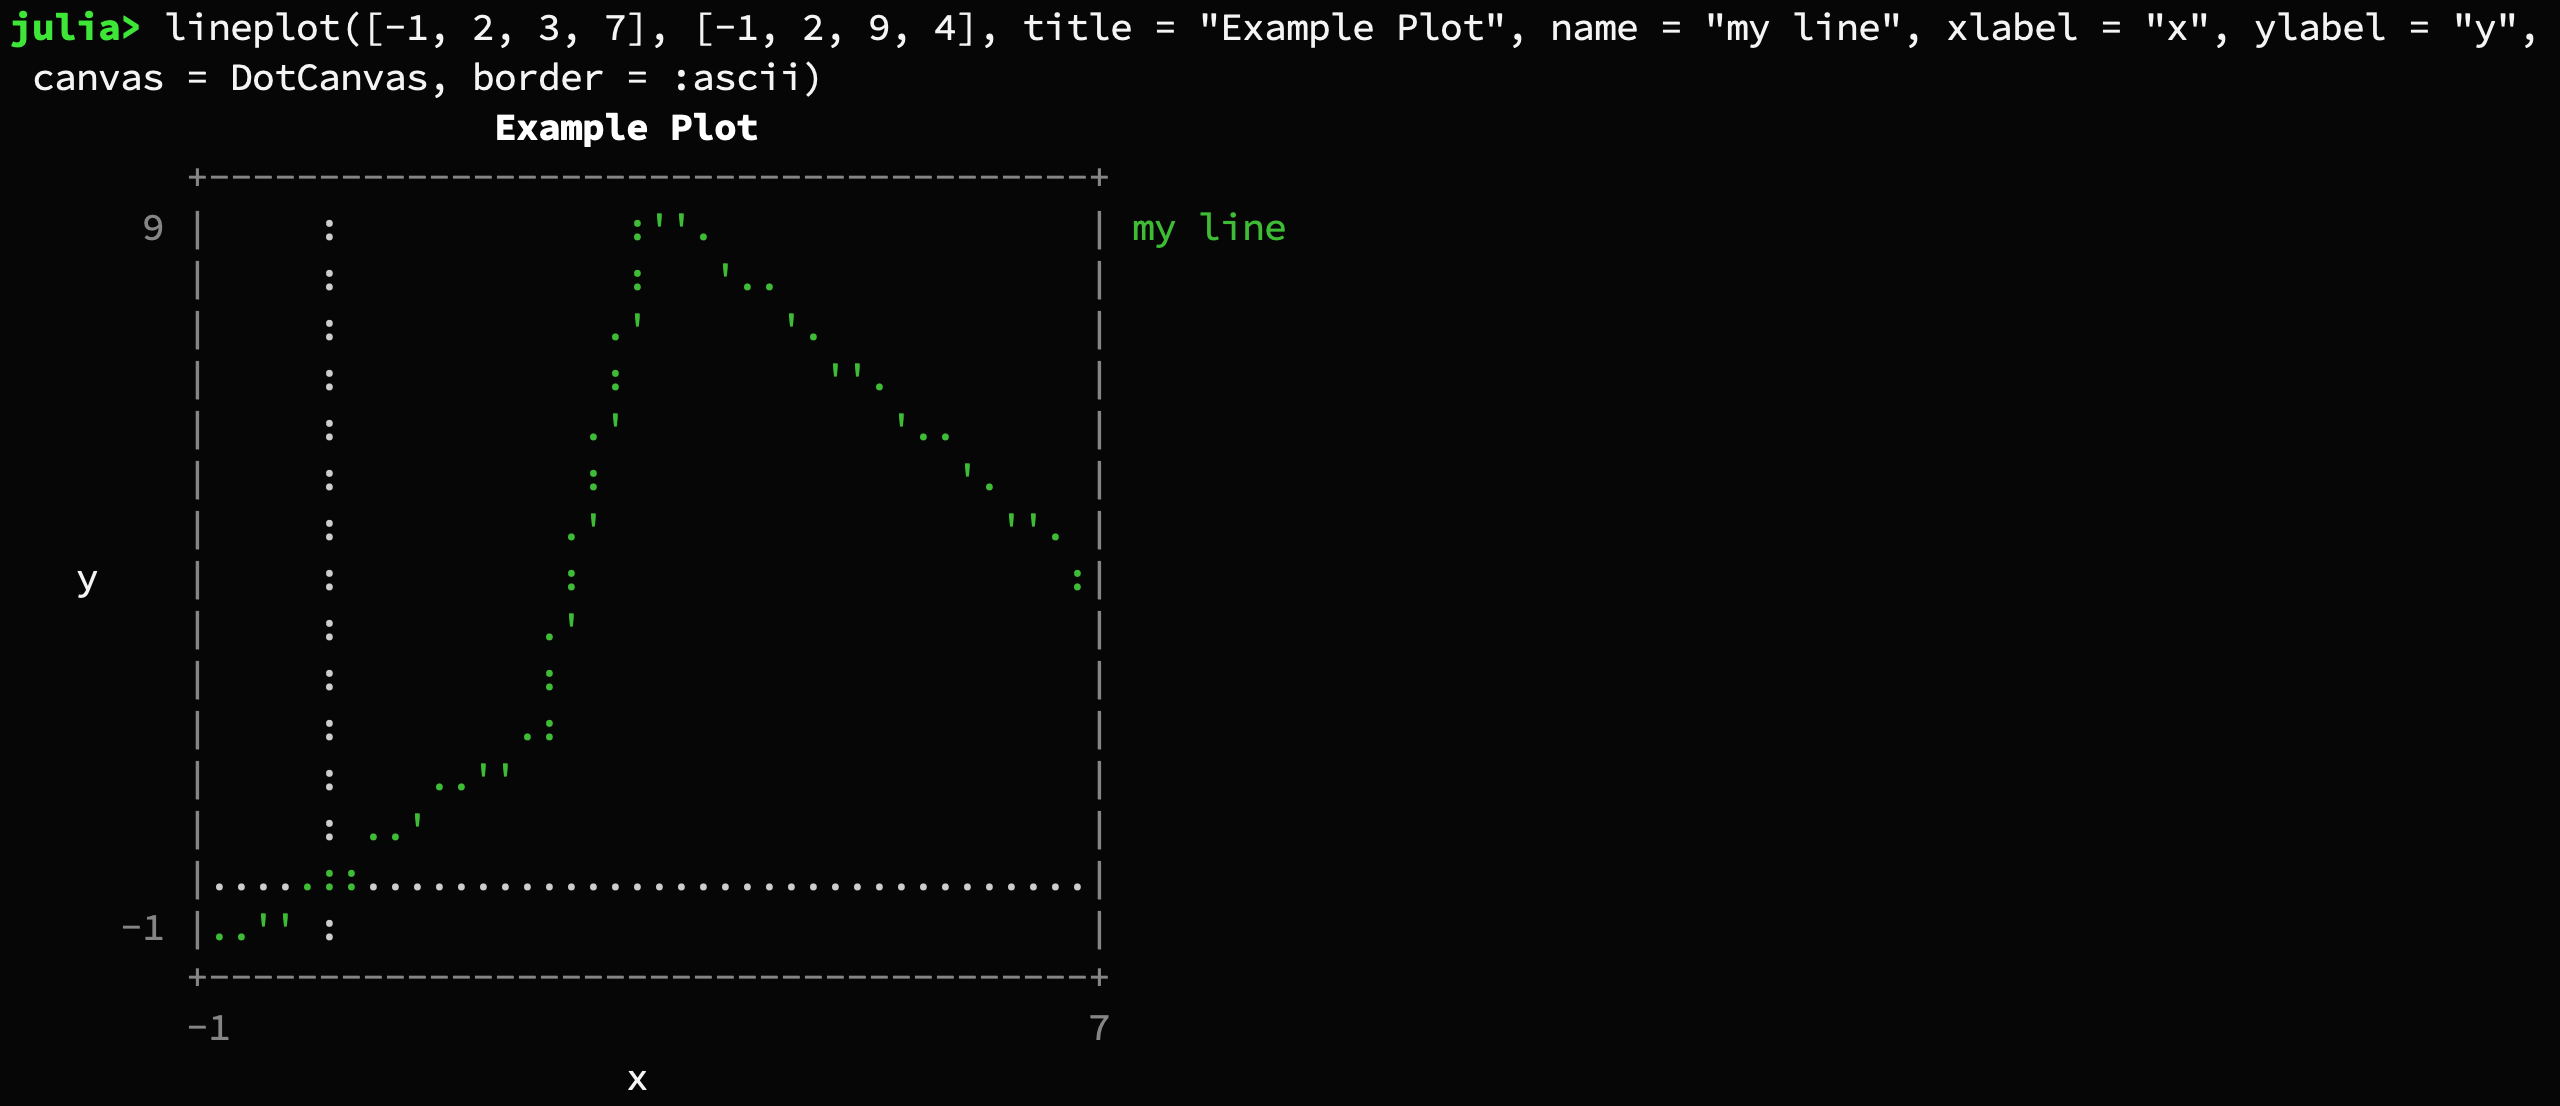
Every plot has a mutating variant that ends with a exclamation mark.
lineplot!(plt, [0, 4, 8], [10, 1, 10], color = :blue, name = "other line")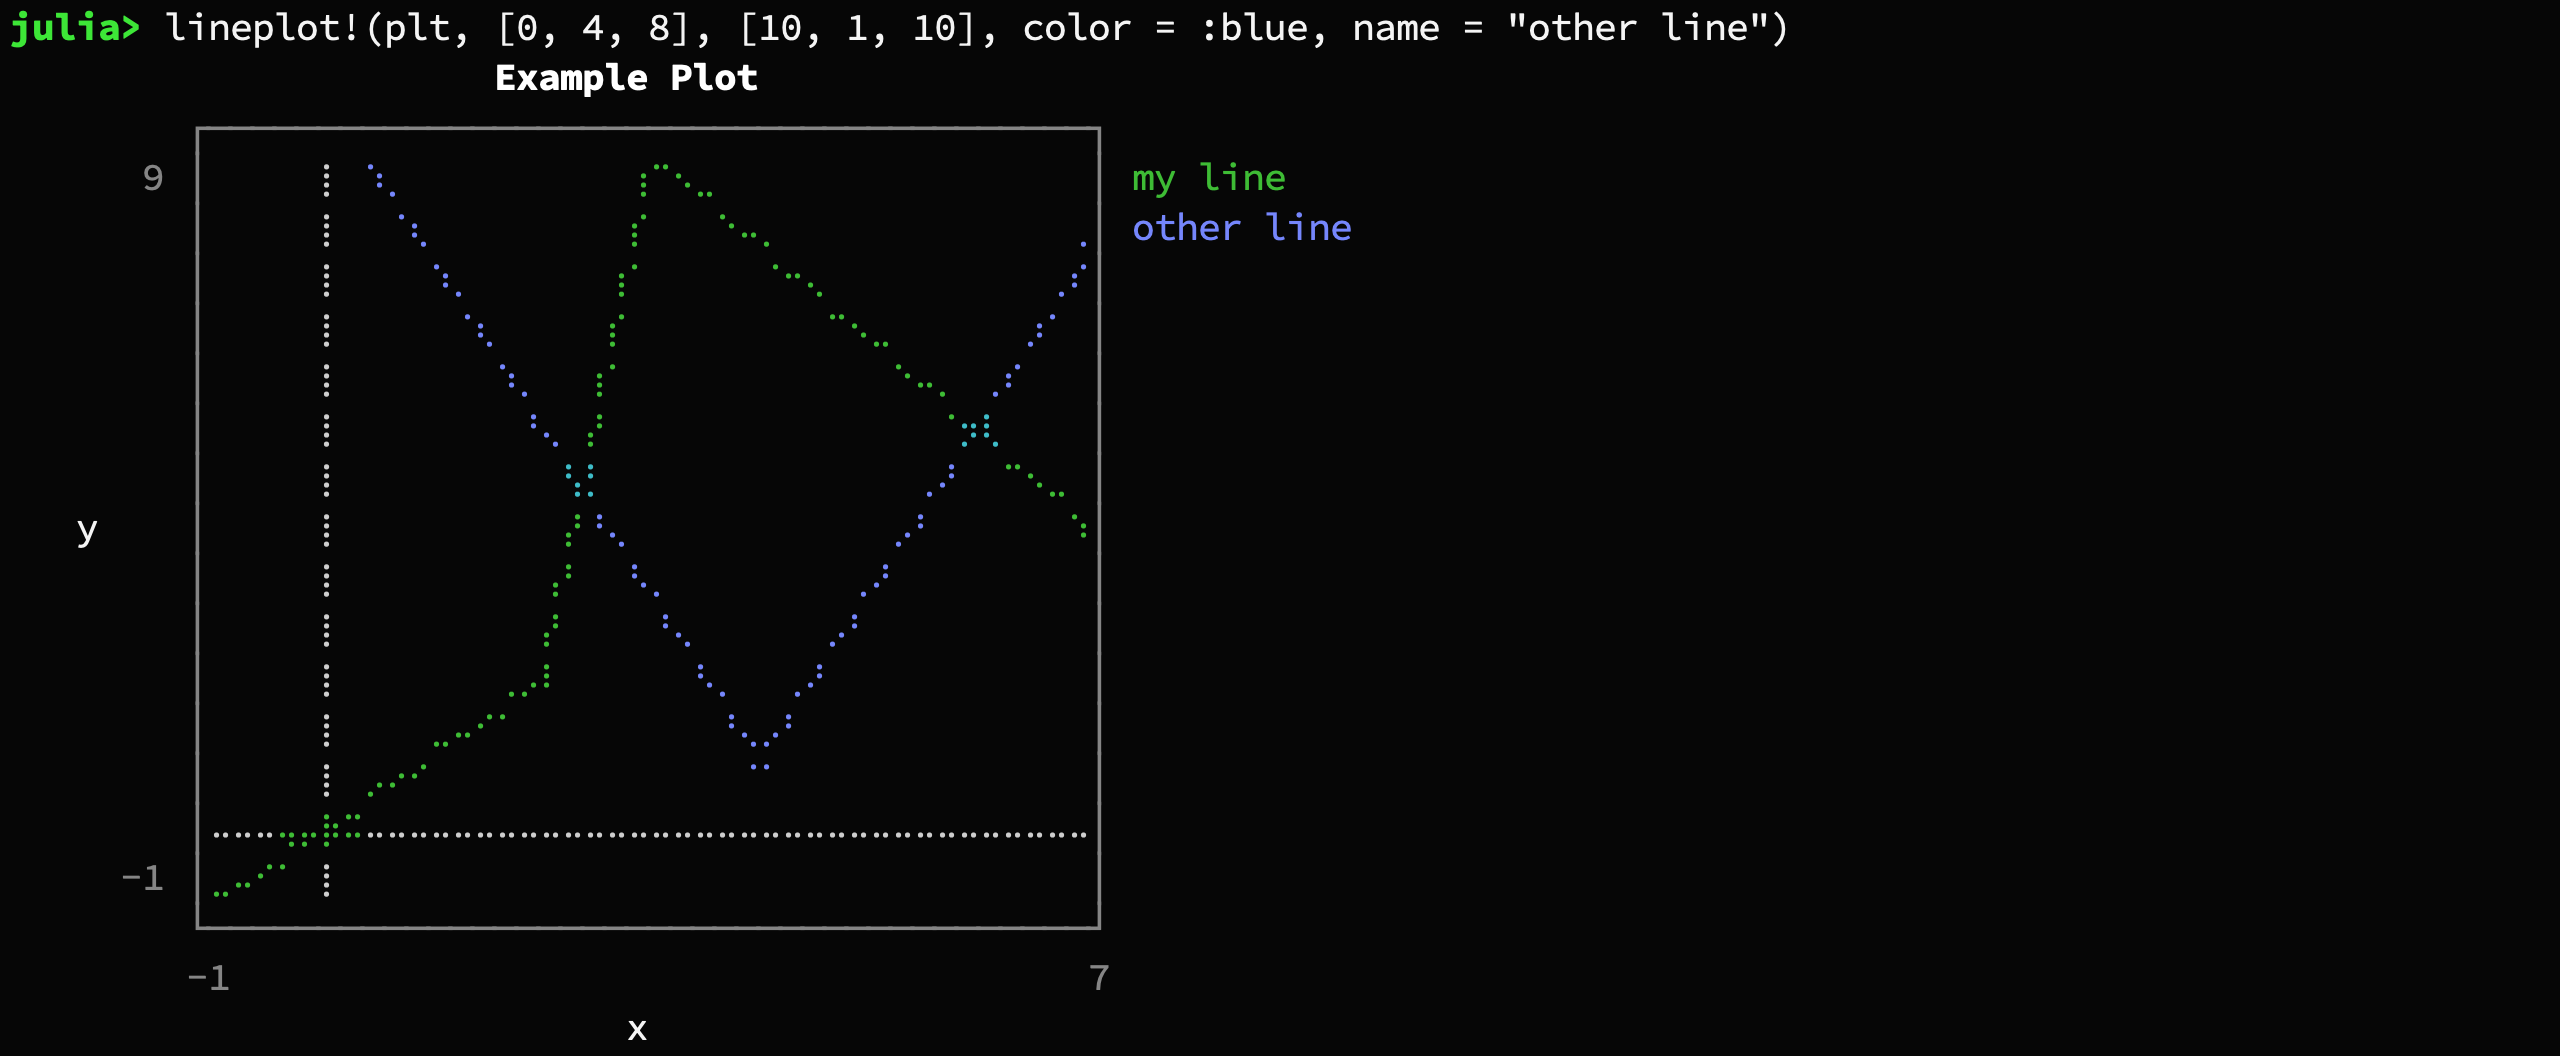
scatterplot(randn(50), randn(50), title = "My Scatterplot")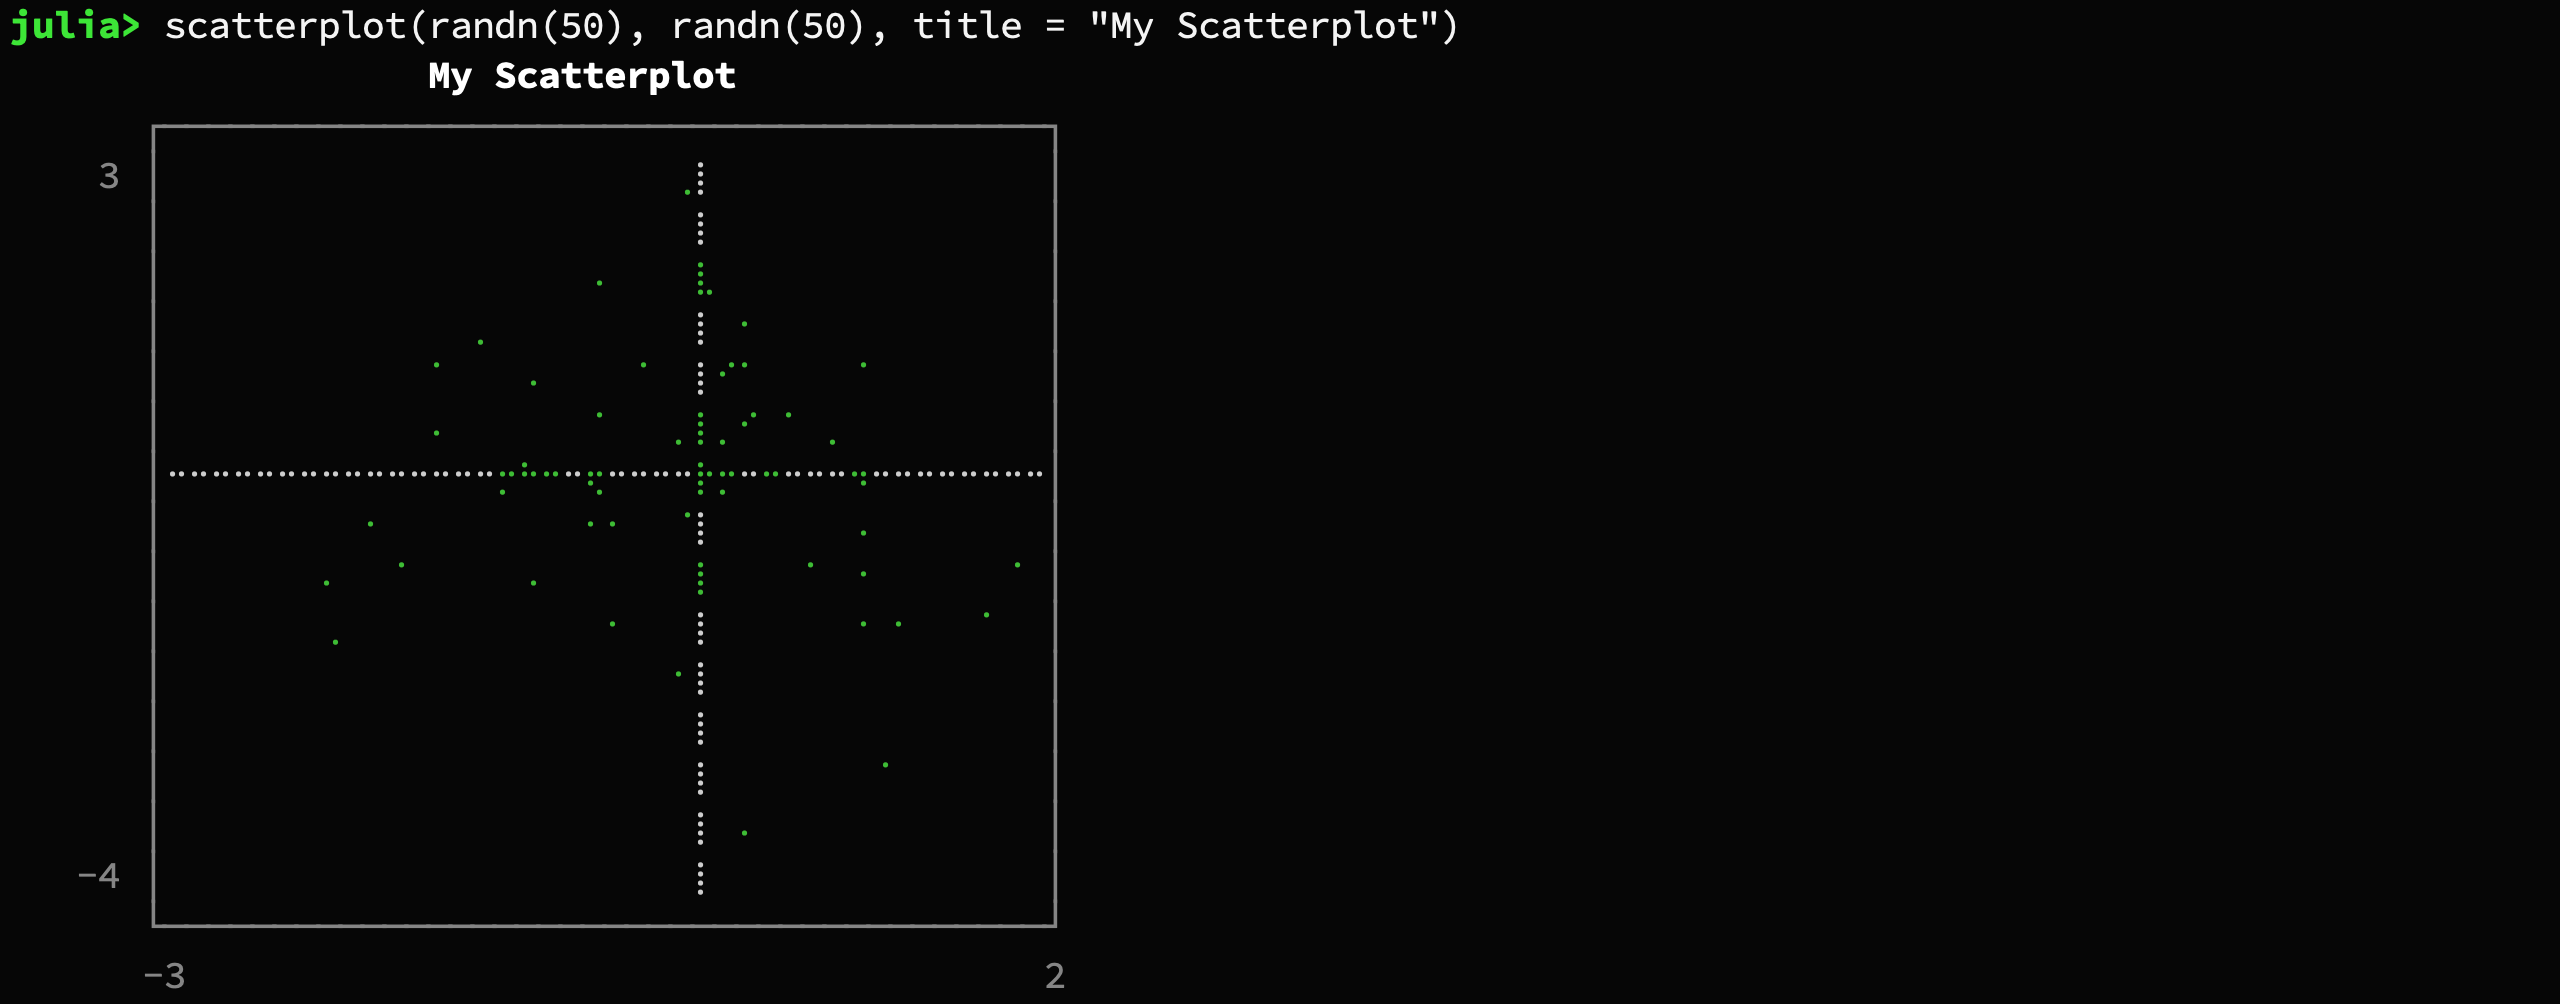
lineplot([1, 2, 7], [9, -6, 8], title = "My Lineplot")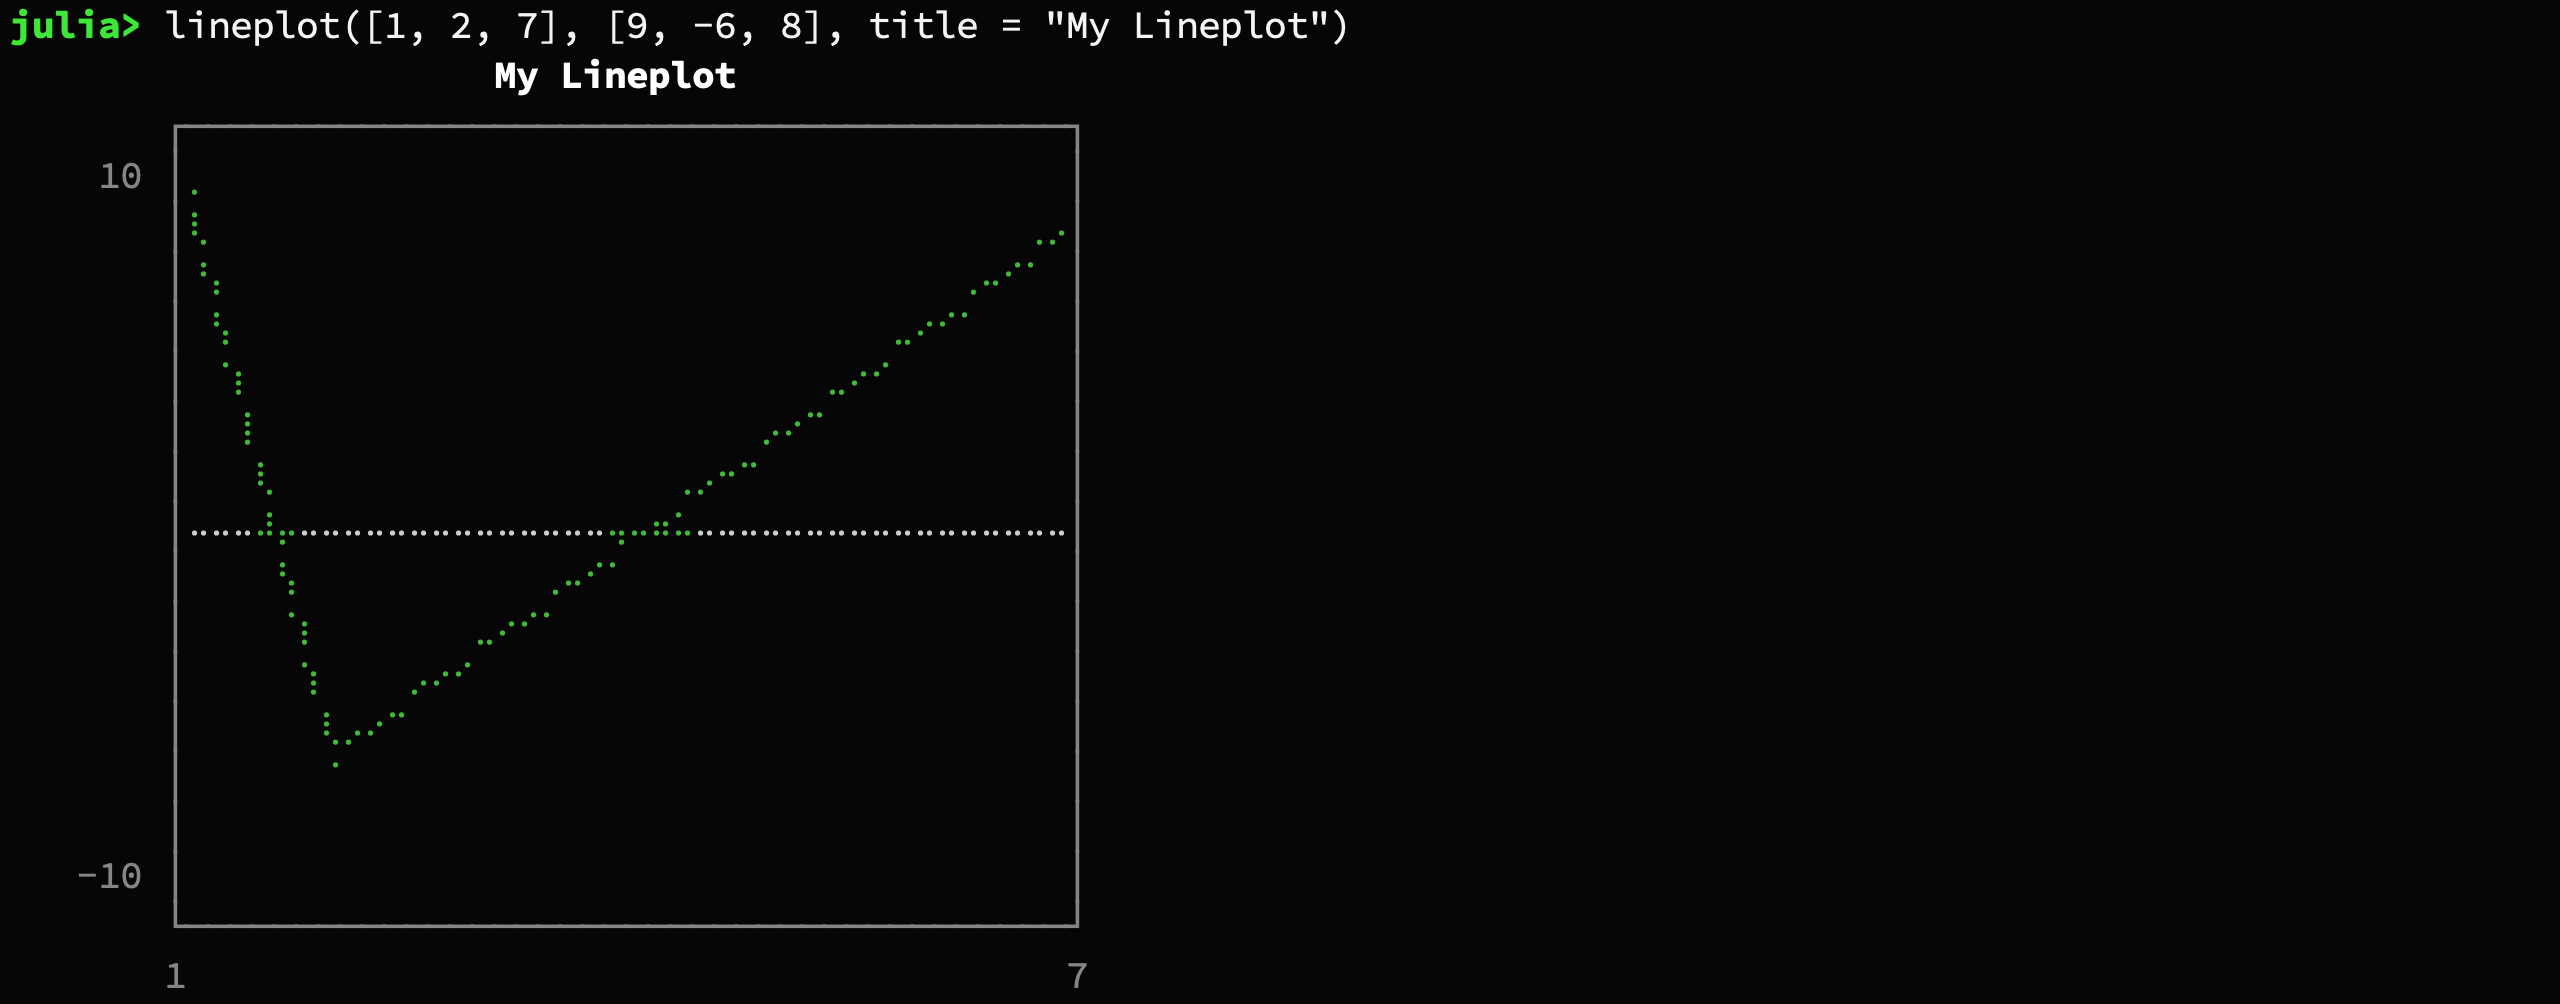
It's also possible to specify a function and a range.
plt = lineplot([cos, sin], -π/2, 2π)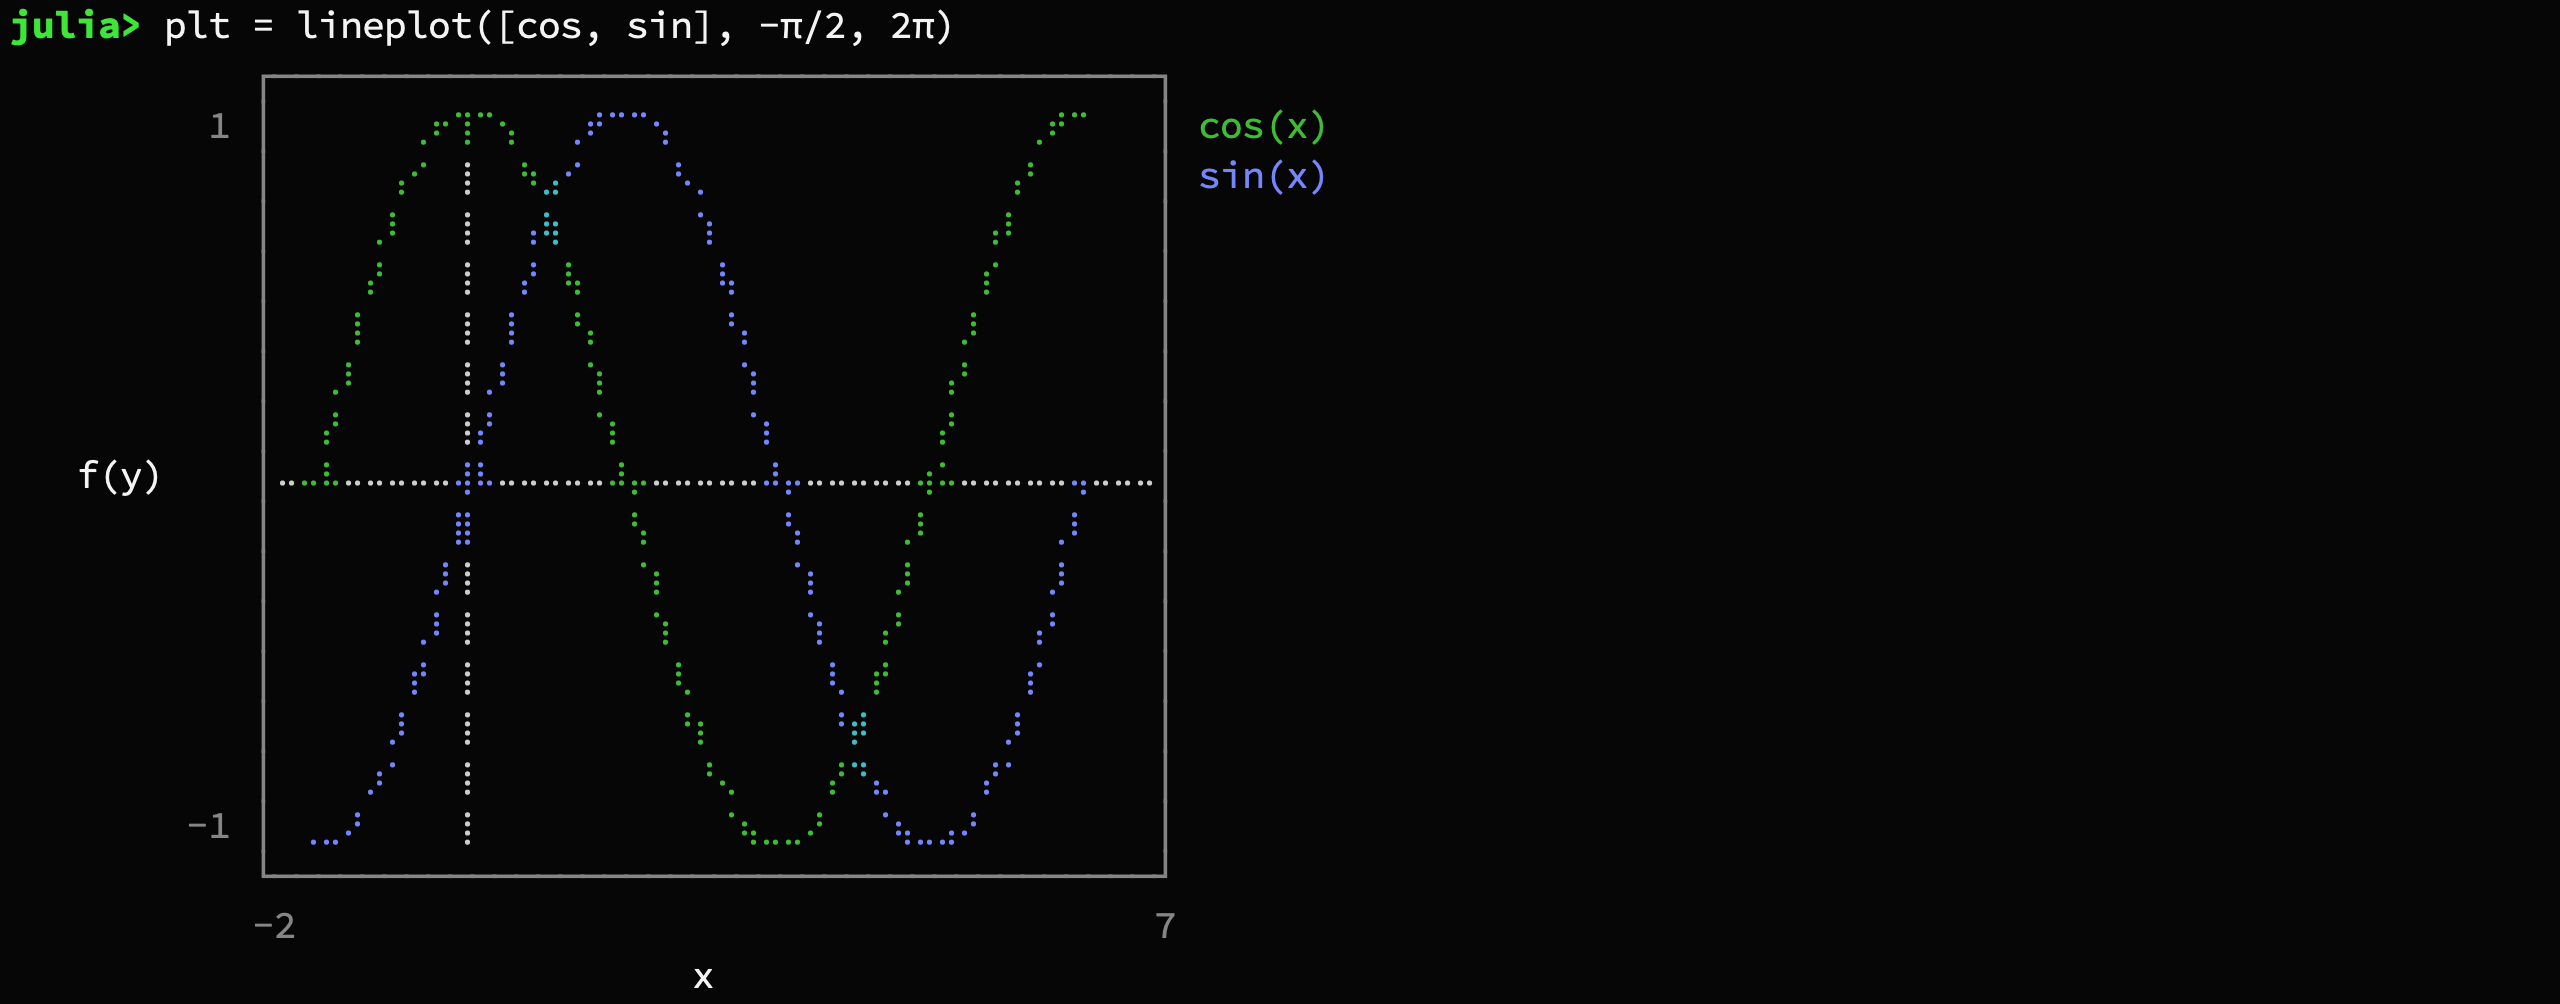
You can also plot lines by specifying an intercept and slope
lineplot!(plt, -0.5, .2, name = "line")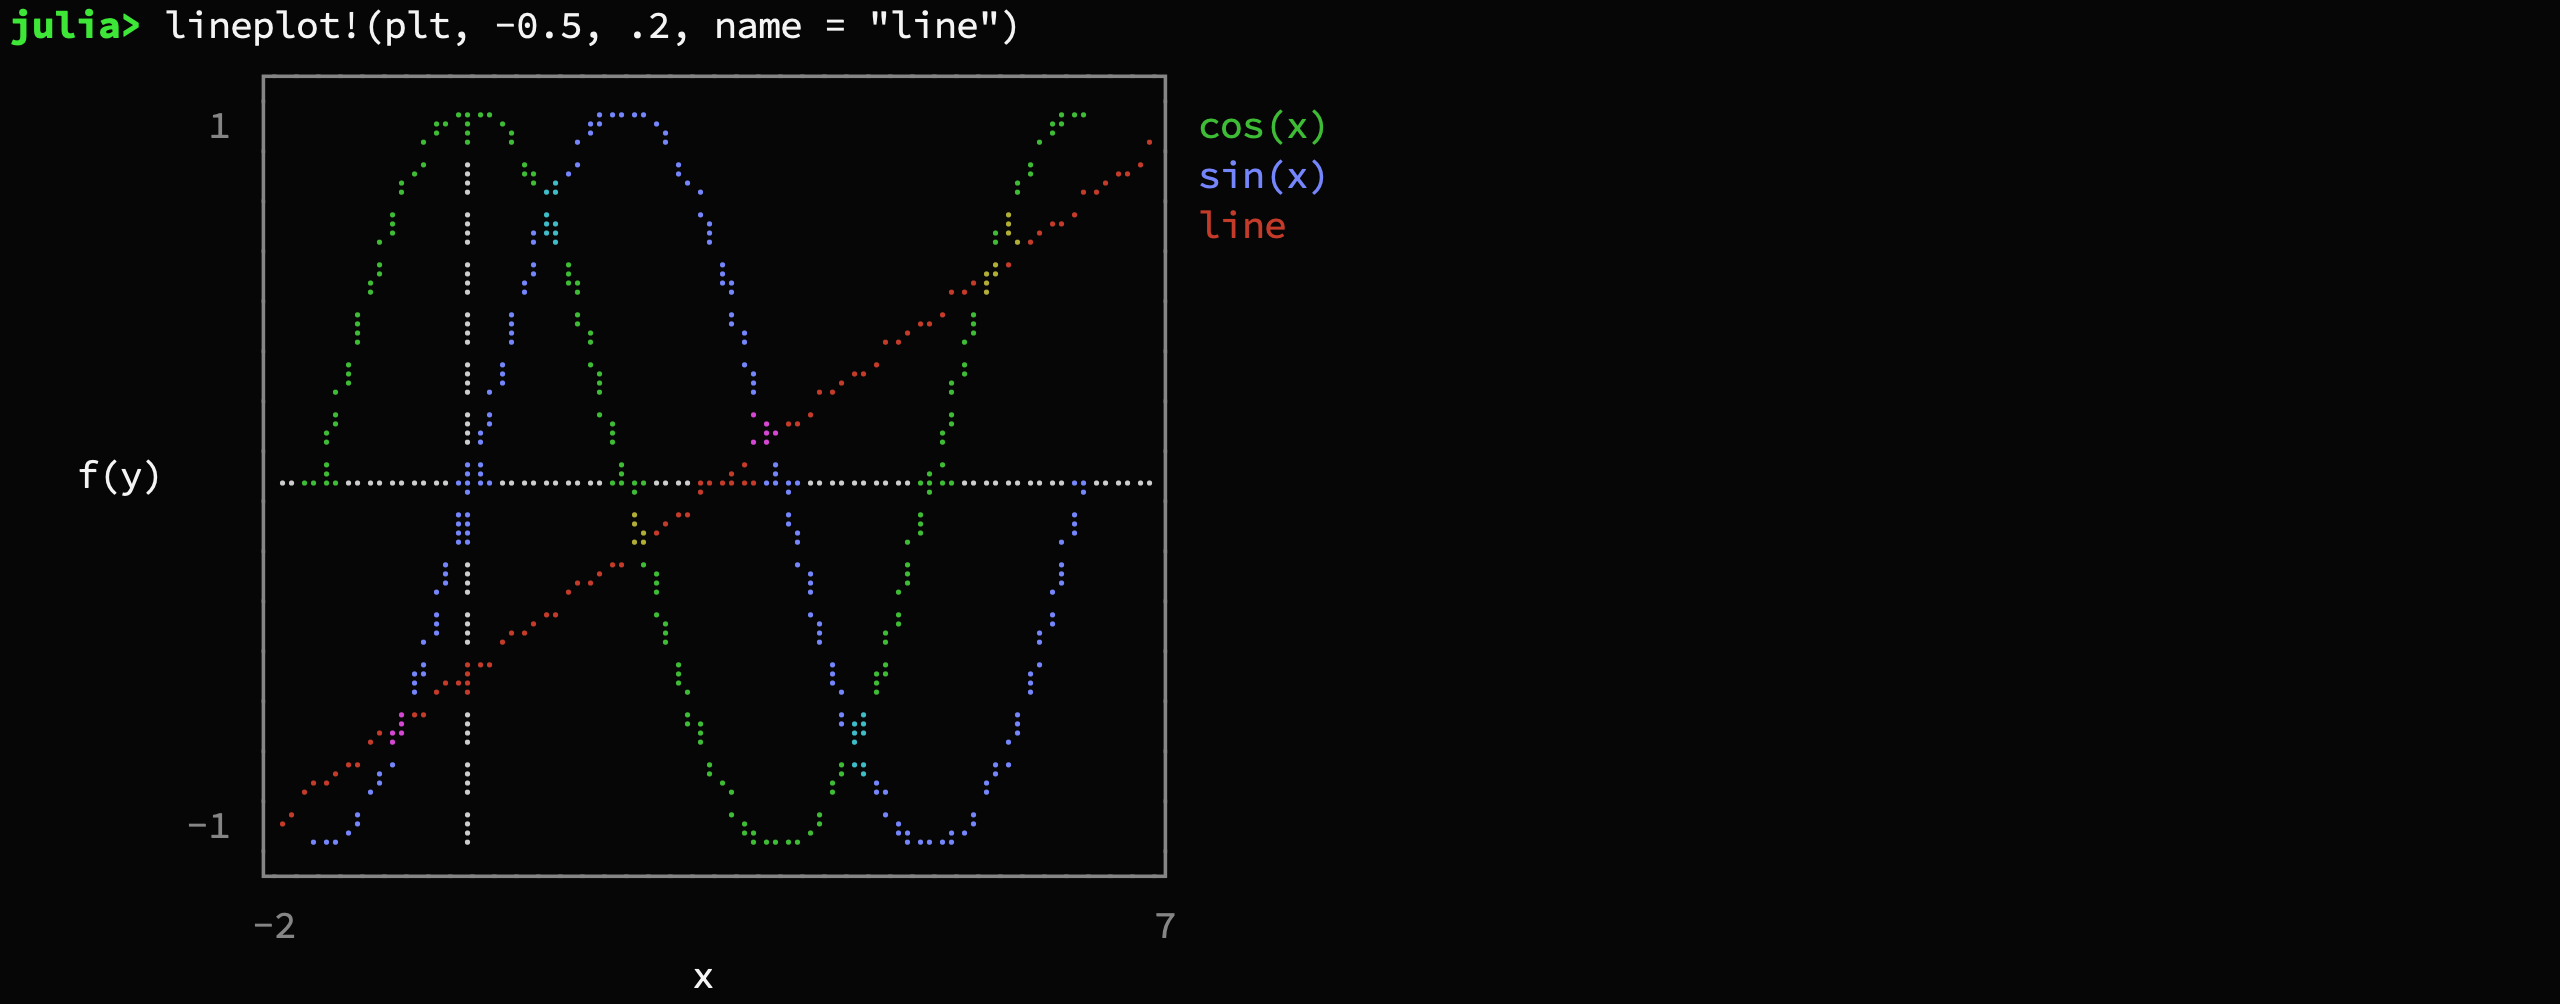
# supported style are :pre and :post
stairs([1, 2, 4, 7, 8], [1, 3, 4, 2, 7], color = :red, style = :post, title = "My Staircase Plot")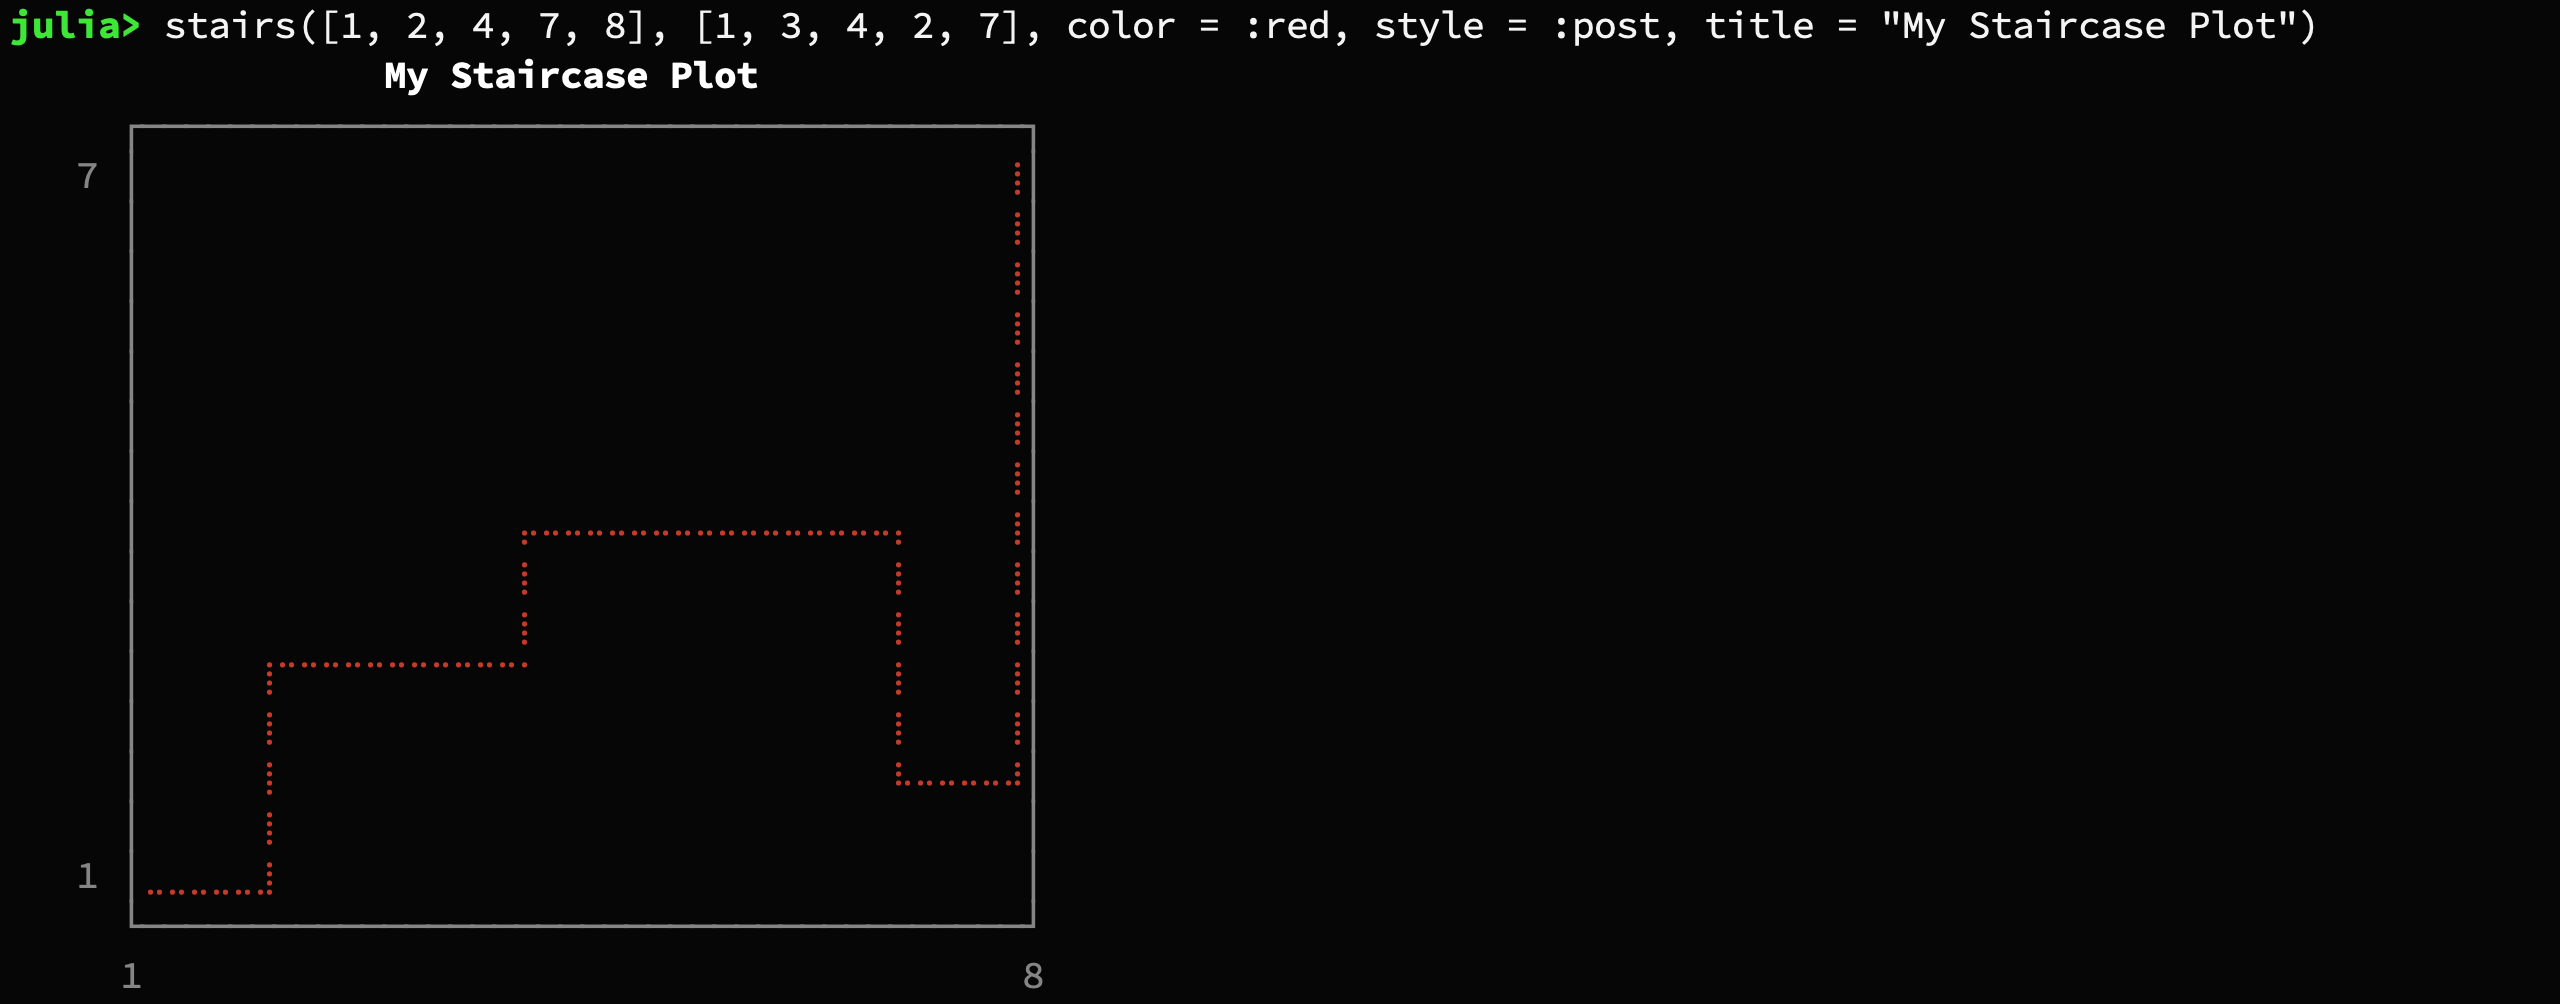
Accepts either two vectors or a dictionary
barplot(["Paris", "New York", "Moskau", "Madrid"],
        [2.244, 8.406, 11.92, 3.165],
        title = "Population")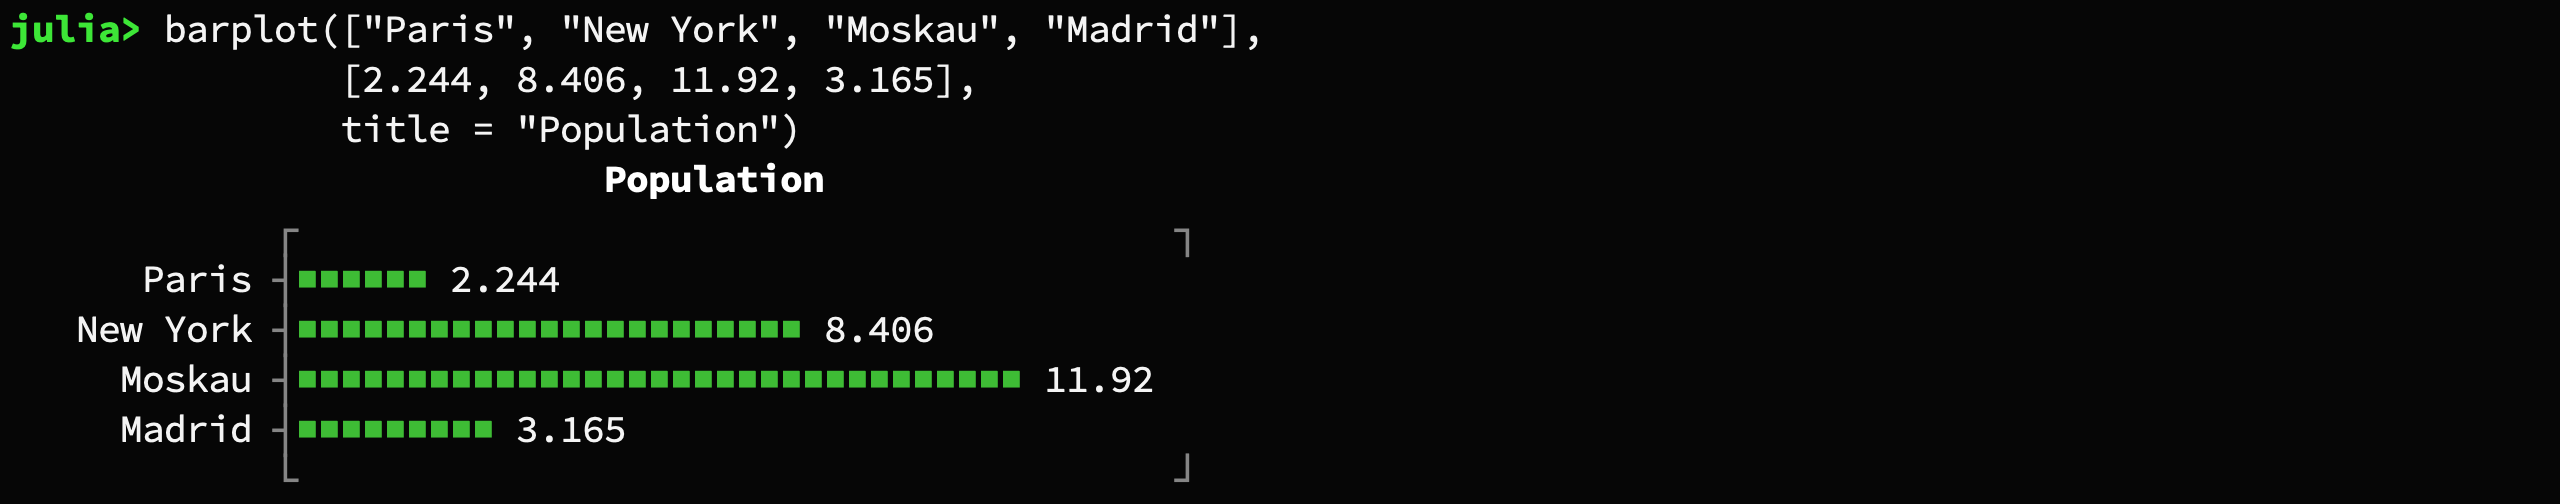
Note: You can use the keyword argument symbols to specify the characters that should
be used to plot the bars. For example symbols = ["#"]
histogram(randn(1000) .* 0.1, nbins = 15, closed = :left)
The histogram function also supports axis scaling using the
parameter xscale.
histogram(randn(1000) .* 0.1, nbins = 15, closed = :right, xscale=log10)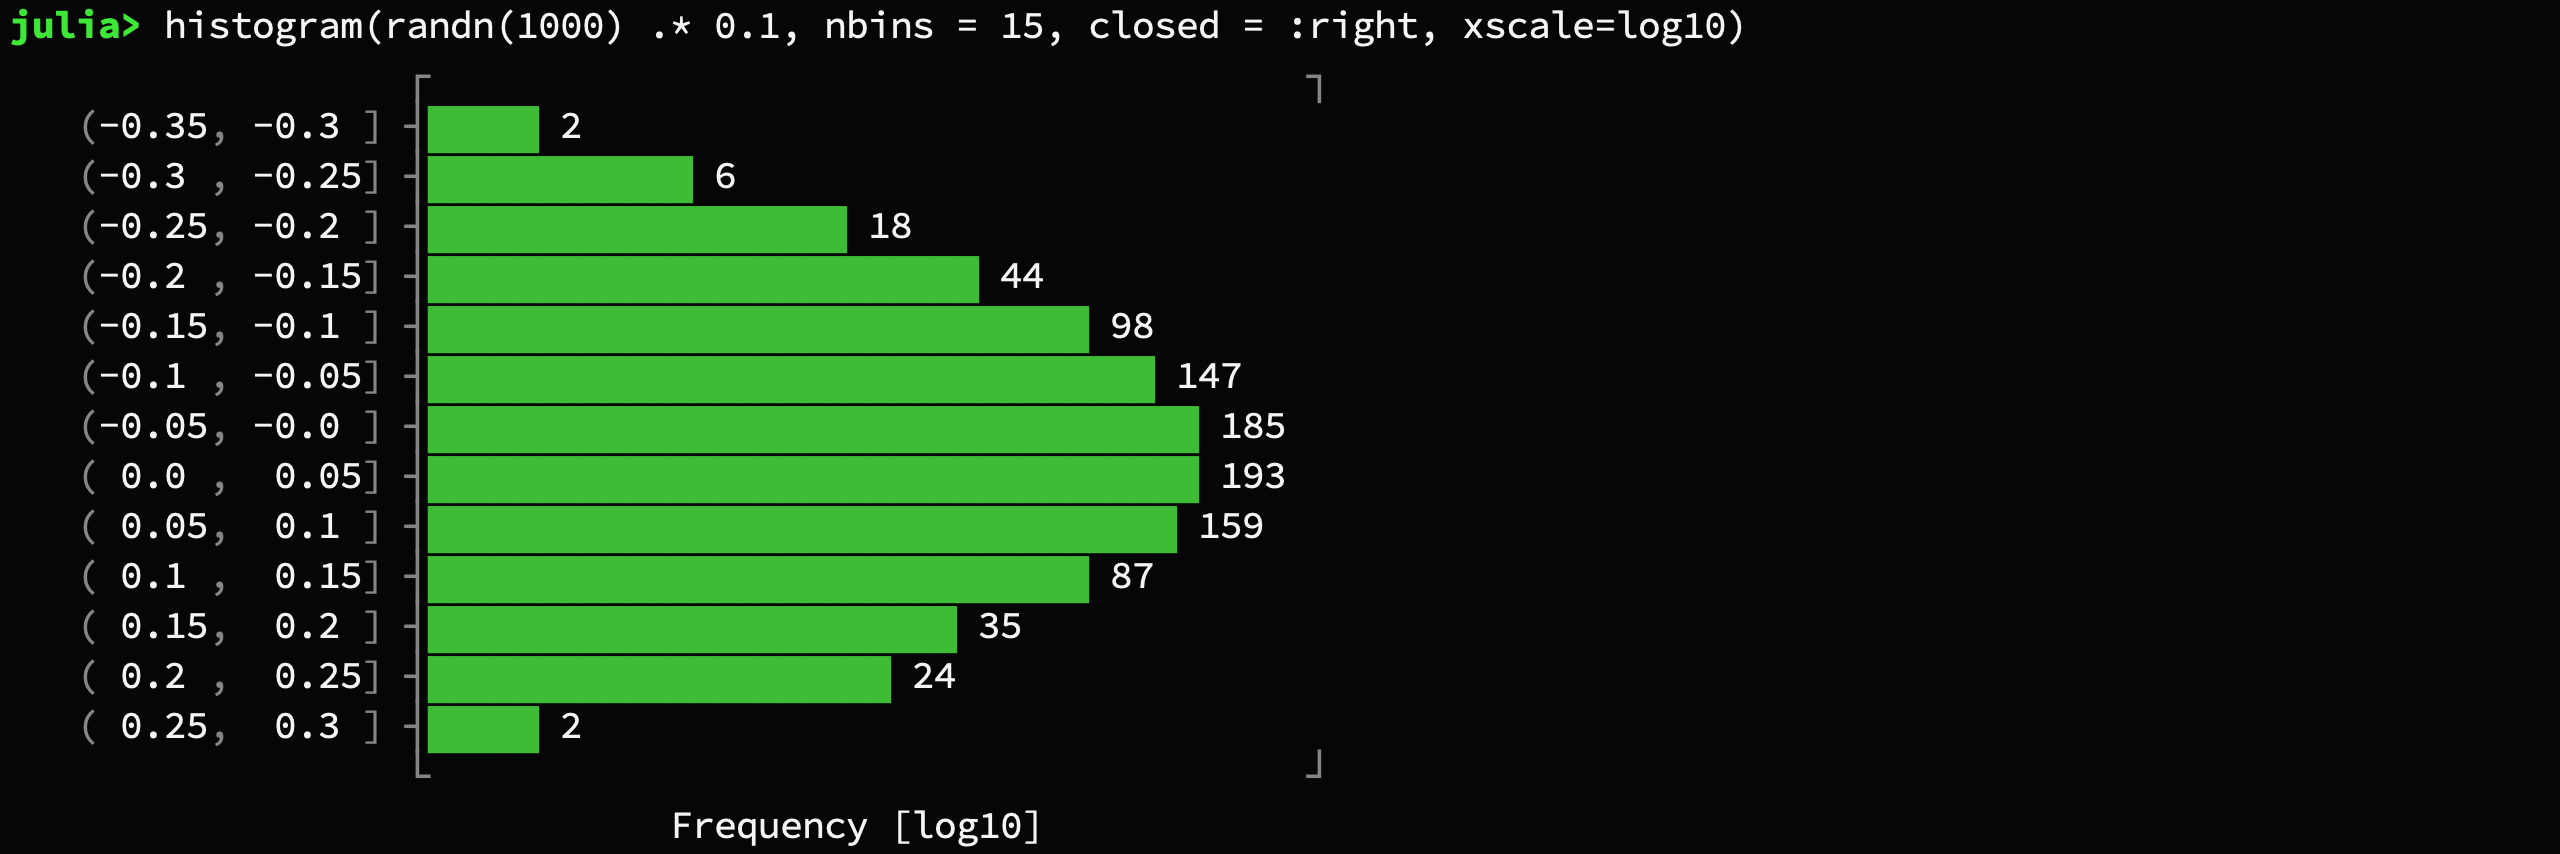
boxplot([1,3,3,4,6,10])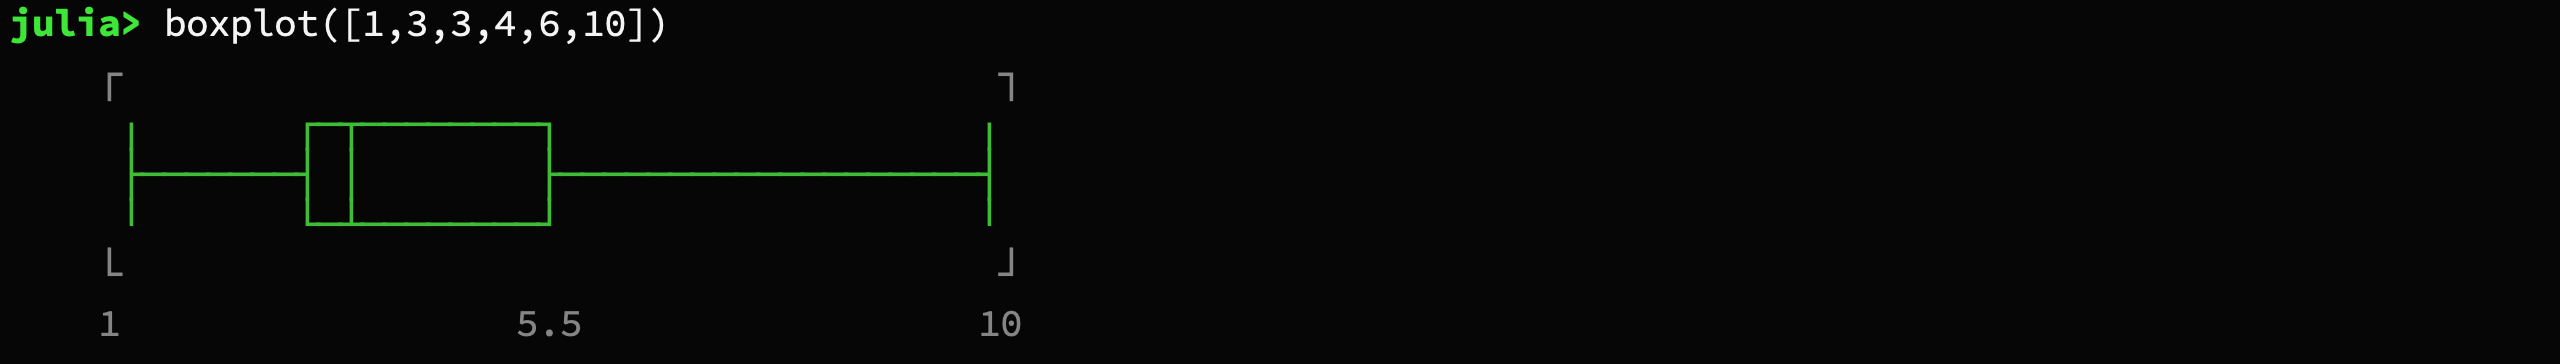
boxplot(["one", "two"], [[1,2,3,4,5], [2,3,4,5,6,7,8,9]], title="Grouped Boxplot", xlabel="x")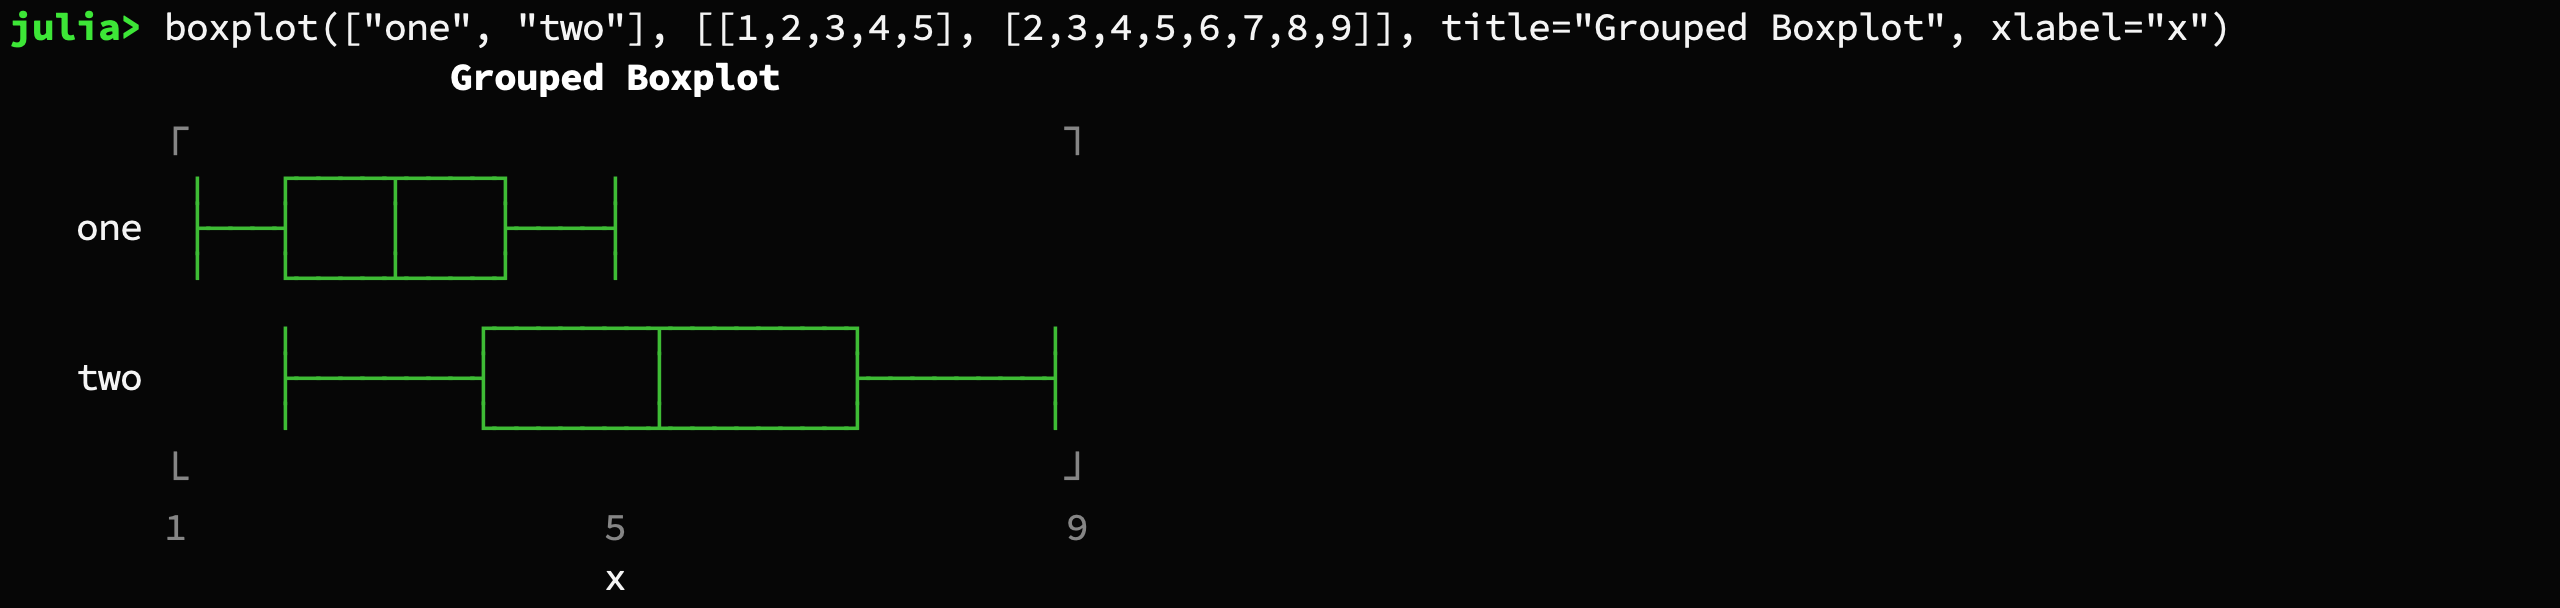
using SparseArrays
spy(sprandn(50, 120, .05))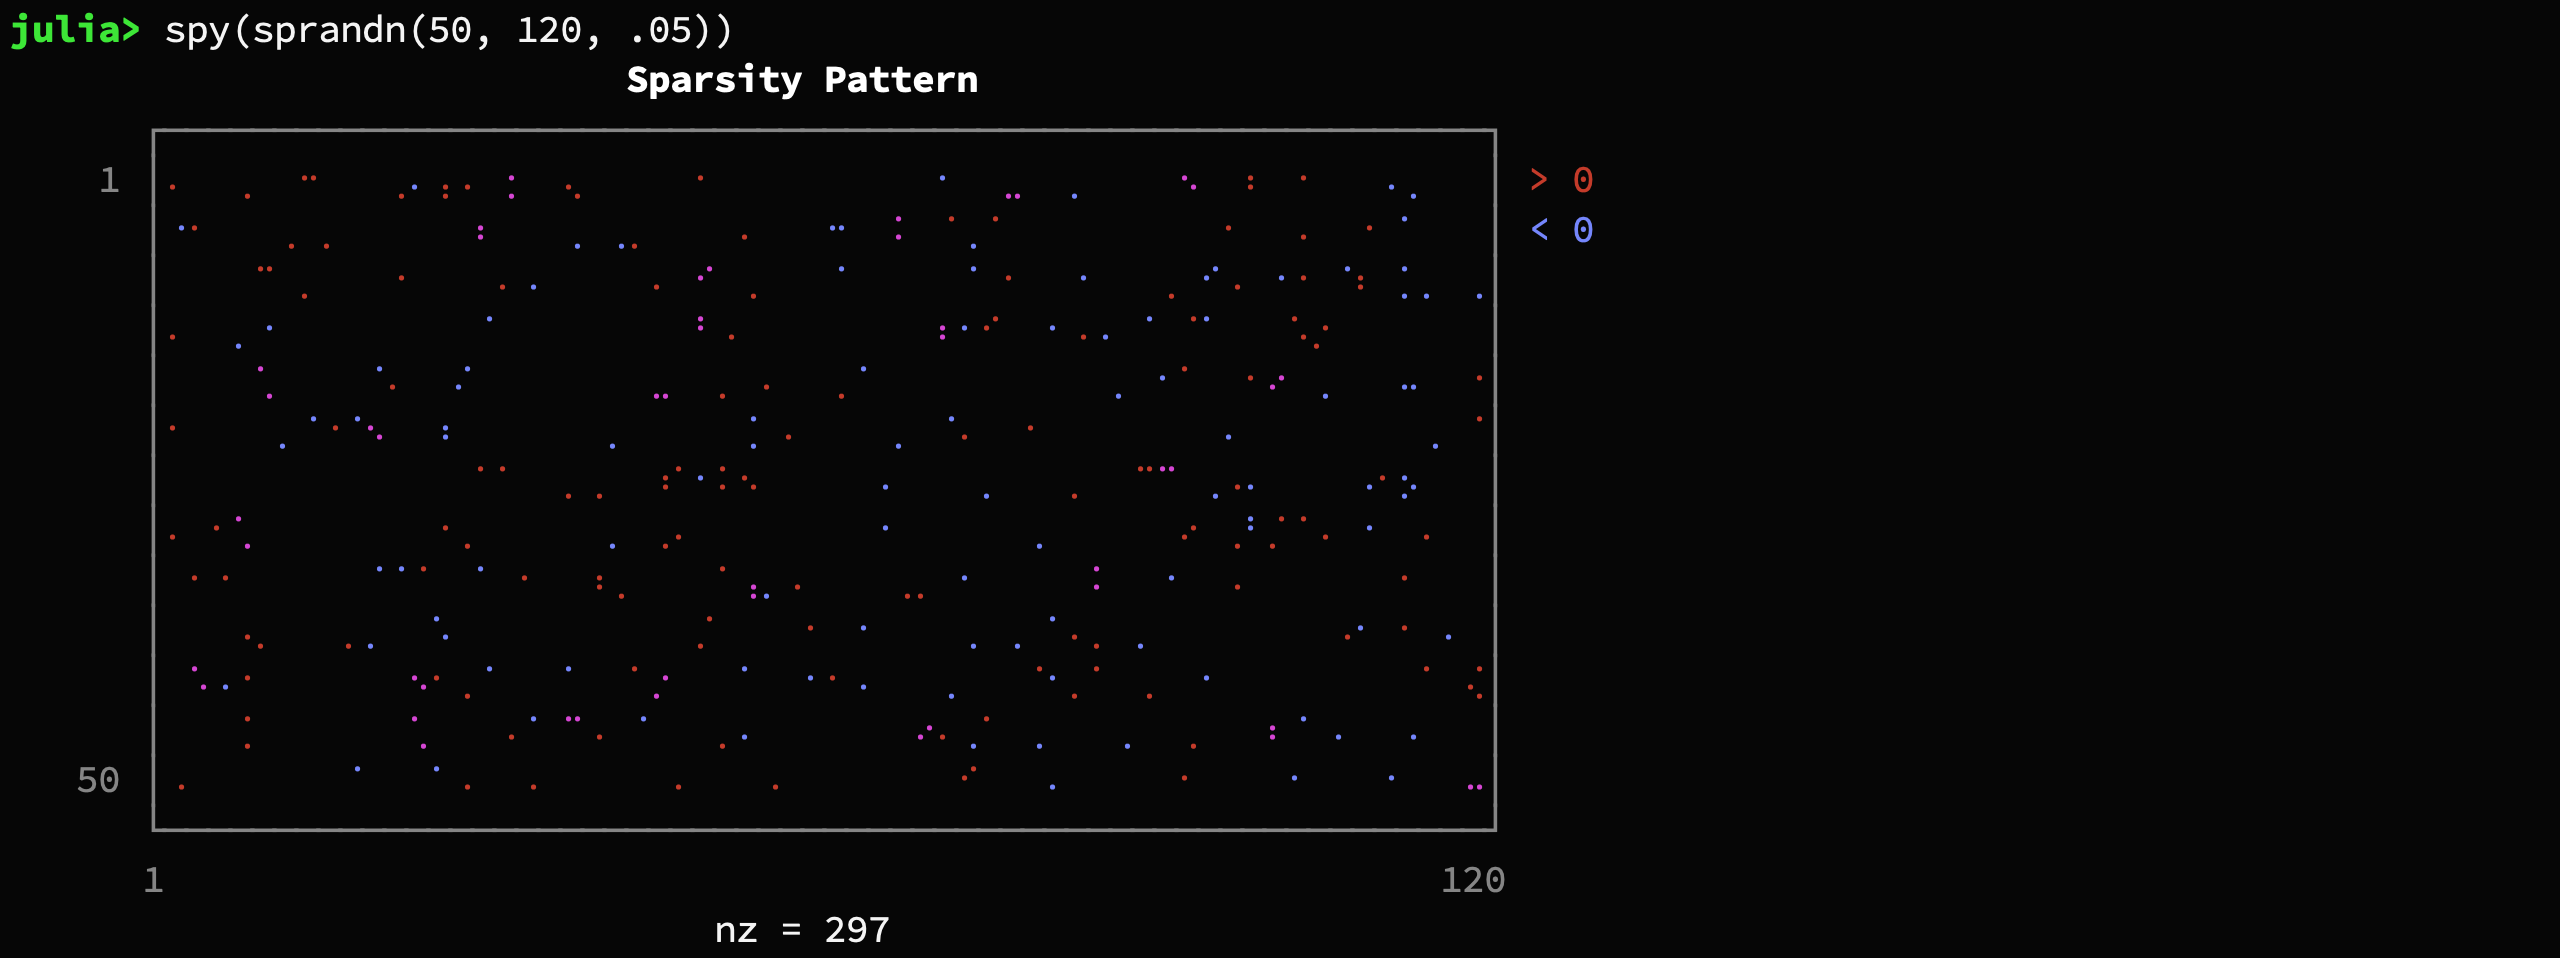
plt = densityplot(randn(1000), randn(1000))
densityplot!(plt, randn(1000) .+ 2, randn(1000) .+ 2)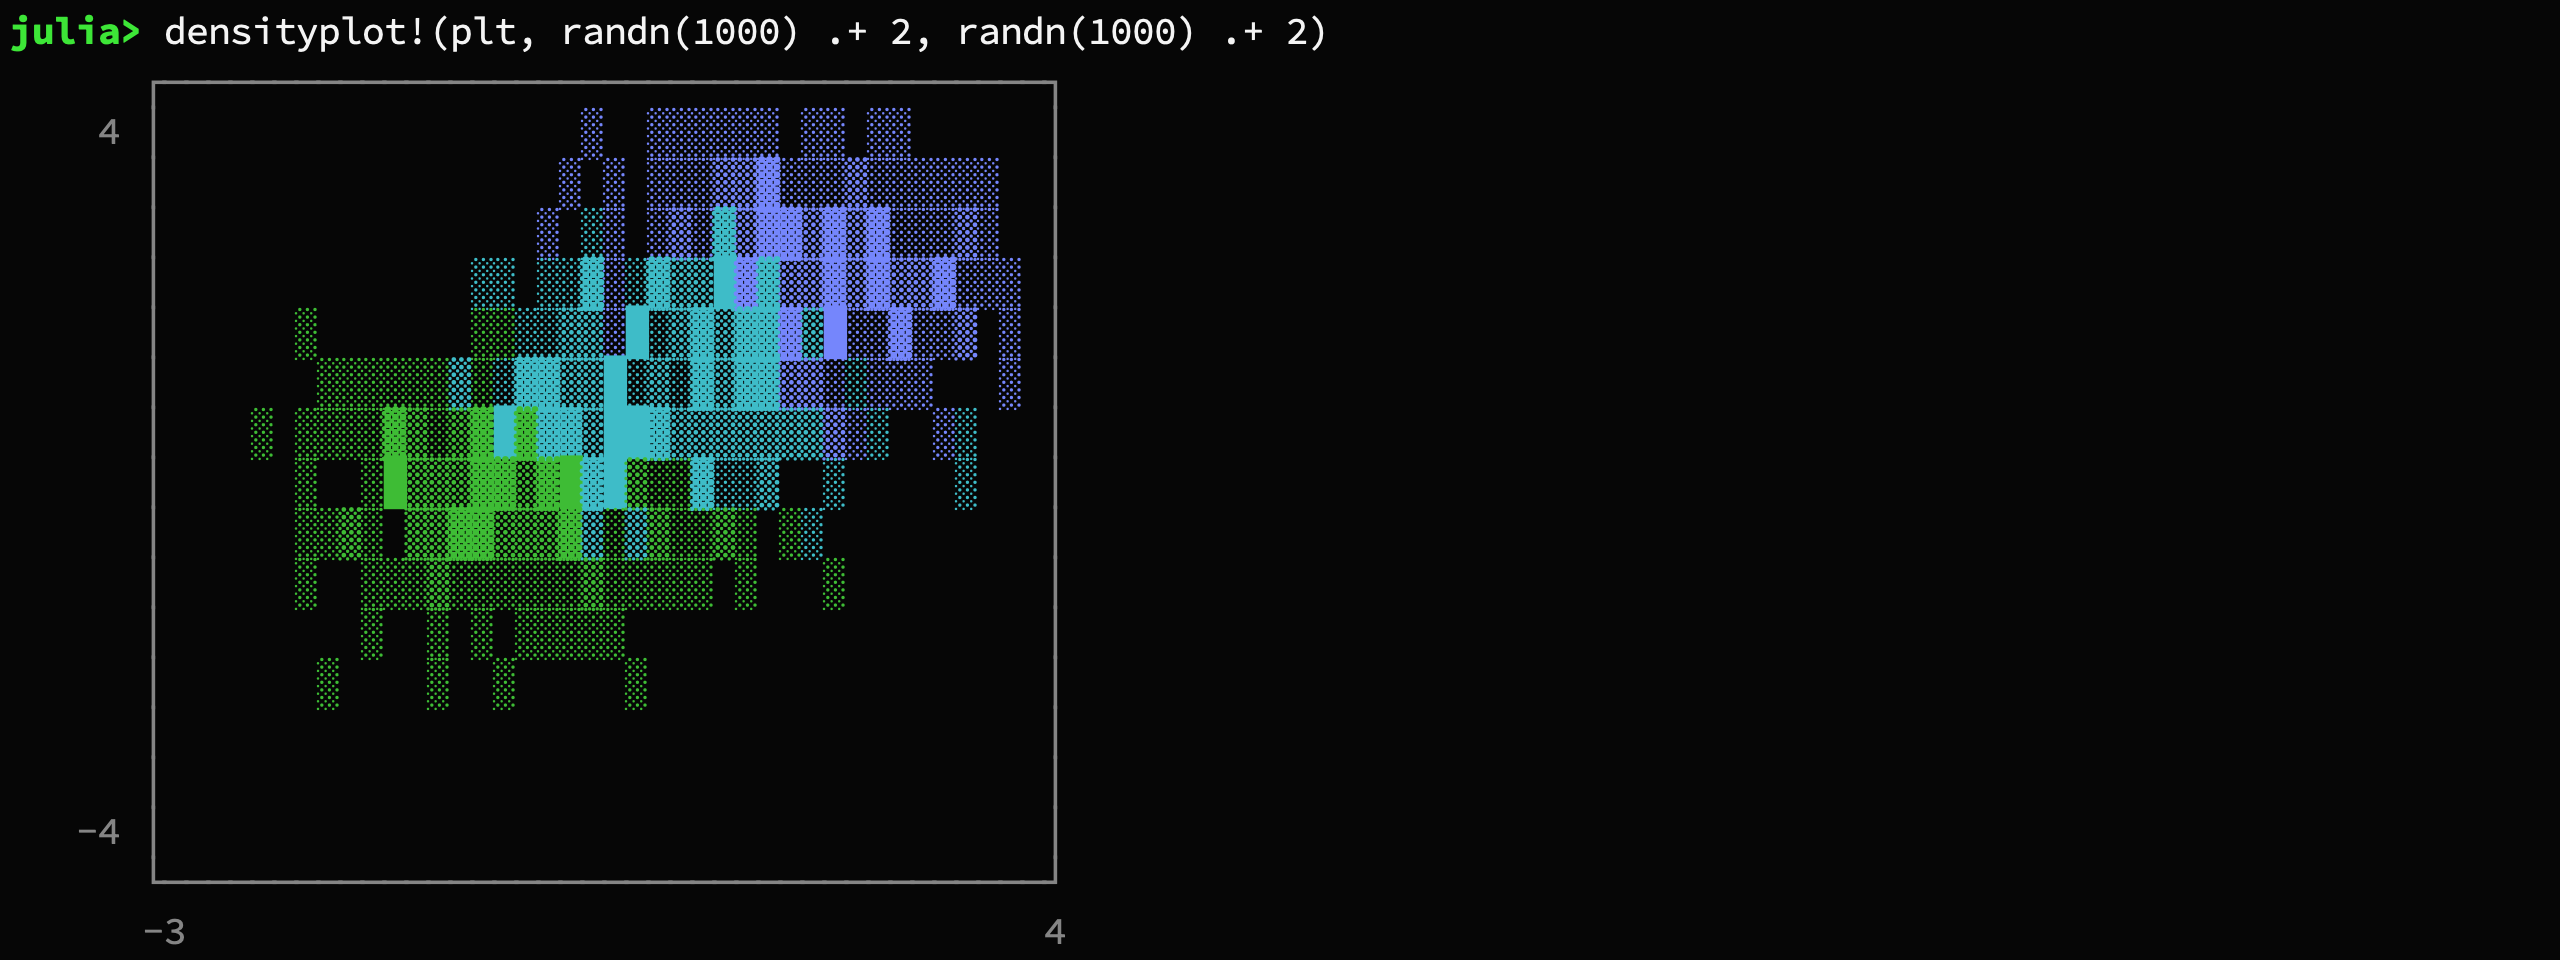
heatmap(repeat(collect(0:10)', outer=(11, 1)), zlabel="z")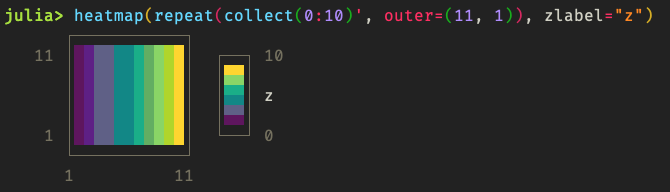
The heatmap function also supports axis scaling using the
parameters xscale, yscale and axis offsets after scaling using xoffset and yoffset.
The colormap parameter may be used to specify a named or custom colormap. See the heatmap function documentation for more details.
In addition, the colorbar and colorbar_border options may be used to enable/disable
the colorbar and configure its border. The zlabel option and zlabel! method
may be used to set the z axis (colorbar) label.
heatmap(collect(0:30) * collect(0:30)', xscale=0.1, yscale=0.1, xoffset=-1.5, colormap=:inferno)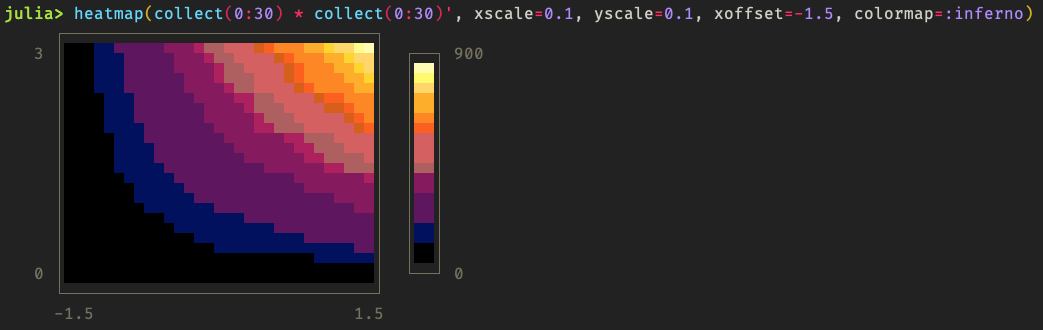
All plots support the set (or a subset) of the following named parameters.
-
title::String = "":Text to display on the top of the plot.
-
name::String = "":Annotation of the current drawing to displayed on the right
-
xlabel::String = "":Description on the x-axis
-
ylabel::String = "":Description on the y-axis
-
width::Int = 40:Number of characters per row that should be used for plotting.
lineplot(sin, 1:.5:20, width = 80)

-
height::Int = 20:Number of rows that should be used for plotting. Not applicable to
barplot.lineplot(sin, 1:.5:20, height = 18)

-
xlim::Vector = [0, 1]:Plotting range for the x coordinate
-
ylim::Vector = [0, 1]:Plotting range for the y coordinate
-
margin::Int = 3:Number of empty characters to the left of the whole plot.
-
border::Symbol = :solid:The style of the bounding box of the plot. Supports
:solid,:bold,:dashed,:dotted,:ascii,:corners, and:none.lineplot([-1.,2, 3, 7], [1.,2, 9, 4], border=:bold) lineplot([-1.,2, 3, 7], [1.,2, 9, 4], border=:dashed) lineplot([-1.,2, 3, 7], [1.,2, 9, 4], border=:dotted) lineplot([-1.,2, 3, 7], [1.,2, 9, 4], border=:none)

-
padding::Int = 1:Space of the left and right of the plot between the labels and the canvas.
-
labels::Bool = true:Can be used to hide the labels by setting
labels=false.lineplot(sin, 1:.5:20, labels=false)

-
grid::Bool = true:Can be used to hide the gridlines at the origin
-
color::Symbol = :auto:Color of the drawing. Can be any of
:green,:blue,:red,:yellow,:cyan,:magenta. -
canvas::Type = BrailleCanvas:The type of canvas that should be used for drawing (see section "Low-level Interface")
-
symbols::AbstractVector{String} = ["▪"]:Barplot only. Specifies the characters that should be used to render the bars
Note: If you want to print the plot into a file but have monospace issues with your font, you should probably try setting border = :ascii and canvas = AsciiCanvas (or canvas = DotCanvas for scatterplots).
-
title!(plot::Plot, title::String)titlethe string to write in the top center of the plot window. If the title is empty the whole line of the title will not be drawn
-
xlabel!(plot::Plot, xlabel::String)xlabelthe string to display on the bottom of the plot window. If the title is empty the whole line of the label will not be drawn
-
ylabel!(plot::Plot, xlabel::String)ylabelthe string to display on the far left of the plot window.
The method annotate! is responsible for the setting all the textual decorations of a plot. It has two functions:
-
annotate!(plot::Plot, where::Symbol, value::String)wherecan be any of::tl(top-left),:t(top-center),:tr(top-right),:bl(bottom-left),:b(bottom-center),:br(bottom-right),:l(left),:r(right)
-
annotate!(plot::Plot, where::Symbol, row::Int, value::String)-
wherecan be any of::l(left),:r(right) -
rowcan be between 1 and the number of character rows of the canvas
-

The primary structures that do all the heavy lifting behind the curtain are subtypes of Canvas. A canvas is a graphics object for rasterized plotting. Basically it uses Unicode characters to represent pixel.
Here is a simple example:
canvas = BrailleCanvas(40, 10, # number of columns and rows (characters)
                       origin_x = 0., origin_y = 0., # position in virtual space
                       width = 1., height = 1.)    # size of the virtual space
lines!(canvas, 0., 0., 1., 1., :blue)     # virtual space
points!(canvas, rand(50), rand(50), :red) # virtual space
lines!(canvas, 0., 1., .5, 0., :yellow)   # virtual space
pixel!(canvas, 5, 8, :red)                # pixel space
You can access the height and width of the canvas (in characters) with nrows(canvas) and ncols(canvas) respectively. You can use those functions in combination with printrow to embed the canvas anywhere you wish. For example, printrow(STDOUT, canvas, 3) writes the third character row of the canvas to the standard output.
As you can see, one issue that arises when multiple pixel are represented by one character is that it is hard to assign color. That is because each of the "pixel" of a character could belong to a different color group (each character can only have a single color). This package deals with this using a color-blend for the whole group.

At the moment there are the following types of Canvas implemented:
-
BrailleCanvas: This type of canvas is probably the one with the highest resolution for Unicode plotting. It essentially uses the Unicode characters of the Braille symbols as pixel. This effectively turns every character into 8 pixels that can individually be manipulated using binary operations.
-
BlockCanvas: This canvas is also Unicode-based. It has half the resolution of the BrailleCanvas. In contrast to BrailleCanvas, the pixels don't have visible spacing between them. This canvas effectively turns every character into 4 pixels that can individually be manipulated using binary operations.
-
HeatmapCanvas: This canvas is also Unicode-based. It has half the resolution of the BlockCanvas. This canvas effectively turns every character into 2 color pixels, using the foreground and background terminal colors. As such, the number of rows of the canvas is half the number of y coordinates being displayed.
-
AsciiCanvas and DotCanvas: These two canvas utilizes only standard ASCII character for drawing. Naturally, it doesn't look quite as nice as the Unicode-based ones. However, in some situations it might yield better results. Printing plots to a file is one of those situations.
-
DensityCanvas: Unlike the BrailleCanvas, the density canvas does not simply mark a "pixel" as set. Instead it increments a counter per character that keeps track of the frequency of pixels drawn in that character. Together with a variable that keeps track of the maximum frequency, the canvas can thus draw the density of datapoints.
-
BarplotGraphics: This graphics area is special in that it does not support any pixel manipulation. It is essentially the barplot without decorations but the numbers. It does only support one method
addrow!which allows the user to add additional bars to the graphics object
To install UnicodePlots, start up Julia and type the following code-snipped into the REPL. It makes use of the native Julia package manger.
using Pkg
Pkg.add("UnicodePlots")This code is free to use under the terms of the MIT license.
Inspired by TextPlots.jl, which in turn was inspired by Drawille