Last active
November 22, 2021 01:00
-
-
Save teddokano/6b1c171d7071ae766b7493b63bd77f53 to your computer and use it in GitHub Desktop.
This file contains bidirectional Unicode text that may be interpreted or compiled differently than what appears below. To review, open the file in an editor that reveals hidden Unicode characters.
Learn more about bidirectional Unicode characters
| #!/usr/bin/env python3 | |
| # run_analize.py | |
| # | |
| # script for running data analisis. | |
| # plotting running data from .fit file | |
| # | |
| # usage: run_analyze.py data.fit | |
| # | |
| # Tedd OKANO, Tsukimidai Communications Syndicate 2021 | |
| # Version 0.9.3 22-November-2021 | |
| # Copyright (c) 2021 Tedd OKANO | |
| # Released under the MIT license | |
| # https://opensource.org/licenses/mit-license.php | |
| import fitpandas | |
| import fitpandas_util as fu | |
| import pandas as pd | |
| import math | |
| import matplotlib.pyplot as plt | |
| import numpy as np | |
| import os.path | |
| import sys | |
| import pytz | |
| from datetime import datetime, timedelta | |
| from timezonefinder import TimezoneFinder | |
| REQUIRED_DATA_COLUMNS = [ | |
| "altitude", | |
| "cadence", | |
| "distance", | |
| "heart_rate", | |
| "speed", | |
| "stance_time", | |
| "step_length", | |
| "timestamp", | |
| "vertical_oscillation", | |
| "vertical_ratio" | |
| ] | |
| PLOT_SETTING = { | |
| "DST": { "axis": None, "color": [ 0, 0, 0 ], "scatter": False, "filtered": False, "source": "distance", "convert": fu.m2km }, | |
| "GCT": { "axis": "upper1", "color": [ 0, 0, 0 ], "scatter": True, "filtered": True, "source": "stance_time", "convert": None }, | |
| "PITCH": { "axis": "upper1", "color": [ 0, 0, 1 ], "scatter": True, "filtered": True, "source": "cadence", "convert": fu.cadence2pitch }, | |
| "VOSC": { "axis": "upper2", "color": [ 1, 0, 0 ], "scatter": True, "filtered": True, "source": "vertical_oscillation", "convert": None }, | |
| "PACE": { "axis": "lower1", "color": [ 0, 0, 0 ], "scatter": True, "filtered": True, "source": "speed", "convert": fu.speed2pace }, | |
| "%HRR": { "axis": "lower2", "color": [ 1, 0, 0 ], "scatter": True, "filtered": True, "source": "heart_rate", "convert": fu.hr2hrr }, | |
| "ALT": { "axis": "lower2", "color": [ 0,.7, 0 ], "scatter": False, "filtered": False, "source": "altitude", "convert": None }, | |
| "STL": { "axis": None, "color": [ 0, 0, 0 ], "scatter": False, "filtered": False, "source": "step_length", "convert": None }, | |
| } | |
| def update_PLOT_SETTING( d ): | |
| for k in PLOT_SETTING.keys(): | |
| if PLOT_SETTING[ k ][ "axis" ] != None: | |
| PLOT_SETTING[ k ][ "axis" ] = d[ PLOT_SETTING[ k ][ "axis" ] ] | |
| SCATTER_ALPHA = 1.0 | |
| SCATTER_ATT = { | |
| k: { "s": 2, "alpha": SCATTER_ALPHA, "color": [ x if 0.5 < x else 0.5 for x in v[ "color" ] ] } | |
| for k, v in zip( PLOT_SETTING.keys(), PLOT_SETTING.values() ) | |
| } | |
| WNDW_LEN = 120 | |
| WINDOW = [ 0.5 * (np.cos( z ) + 1.0) for z in np.linspace( -np.pi, np.pi, WNDW_LEN) ] | |
| WINDOW = [ x / sum( WINDOW ) for x in WINDOW ] | |
| def main(): | |
| if 2 > len( sys.argv ): | |
| print( "error: no files given to plot" ) | |
| sys.exit( 1 ) | |
| fig = plt.figure(figsize=(12, 12)) | |
| ax1 = fig.add_subplot(211) | |
| ax2 = ax1.twinx() | |
| bx1 = fig.add_subplot(212) | |
| bx2 = bx1.twinx() | |
| setting = { | |
| "upper1": ax1, | |
| "upper2": ax2, | |
| "lower1": bx1, | |
| "lower2": bx2 | |
| } | |
| update_PLOT_SETTING( setting ) | |
| input_files = sys.argv[ 1 : ] | |
| data_df_array, session_df = read_files( input_files ) | |
| stat = session_df.describe() | |
| axis_setting( ax1, ax2, bx1, bx2, stat ) | |
| alpha_value = 1.0 | |
| for file_name in input_files: | |
| data = data_df_array[ file_name ] | |
| session = session_df[ file_name : file_name ] | |
| session = session.to_dict( orient = "records" )[ 0 ] | |
| start_time = data.iloc[ 0 ][ "timestamp" ] | |
| finish_time = data.iloc[ -1 ][ "timestamp" ] | |
| elapsed_time= finish_time - start_time | |
| # elapsed_time = data.iloc[ -1 ][ "timestamp" ] - data.iloc[ -1 ][ "timestamp" ] | |
| # print( "elapsed_time = ", elapsed_time, " - ", elapsed_time.total_seconds() / data.iloc[ -1 ][ "distance" ] ) | |
| plot_label = get_local_session_start_time( session ) + " " + fu.second2MS( fu.speed2pace( session[ "avg_speed" ] ) ) + "/km" | |
| plot_att = { | |
| k: { "color": v[ "color" ], "alpha": alpha_value, "label": "{} - {}".format( k, file_name ) } | |
| for k, v in zip( PLOT_SETTING.keys(), PLOT_SETTING.values() ) | |
| } | |
| plot_att[ "PACE" ][ "label" ] = "PACE - {} - {}".format( plot_label, file_name ) | |
| if 1 == len( input_files ): | |
| for label, item in PLOT_SETTING.items(): | |
| if PLOT_SETTING[ label ][ "scatter" ]: | |
| item[ "axis" ].scatter( data[ "DST" ], data[ label ], **SCATTER_ATT[ label ] ) | |
| if alpha_value == 1.0: | |
| bx2.plot( data[ "DST" ], data[ "ALT" ], **plot_att[ "ALT" ] ) | |
| for label, item in PLOT_SETTING.items(): | |
| if PLOT_SETTING[ label ][ "filtered" ]: | |
| item[ "axis" ].plot( data[ "DST" ], data[ label + "_filtered" ], **plot_att[ label ] ) | |
| alpha_value *= 0.5 | |
| ax1.legend( loc='upper left', borderaxespad=1, fontsize=9 ) | |
| ax2.legend( loc='lower right', borderaxespad=1, fontsize=9 ) | |
| ax1.grid() | |
| bx1.legend( loc='upper left', borderaxespad=1, fontsize=9 ) | |
| bx2.legend( loc='lower right', borderaxespad=1, fontsize=9 ) | |
| bx1.grid() | |
| plt.savefig( "-".join( sys.argv ) + ".png", dpi=300, bbox_inches="tight", pad_inches=0.05 ) | |
| plt.show() | |
| def read_files( input_files ): | |
| data_df_ar = {} | |
| sesion_ar = [] | |
| for file_name in input_files: | |
| print( "reading " + file_name + " .." ) | |
| fn, file_ext = os.path.splitext( file_name ) | |
| if ".fit" != file_ext.lower(): | |
| print( "cannot read .fit format file only" ) | |
| continue | |
| data_df, session, units = fitpandas.get_workout( file_name ) | |
| convert_data( data_df ) | |
| data_df_ar[ file_name ] = data_df | |
| sesion_ar.append( session ) | |
| session_df = pd.DataFrame( sesion_ar, index = input_files ) | |
| convert_session( session_df ) | |
| return data_df_ar, session_df | |
| def axis_setting( ax1, ax2, bx1, bx2, stat ): | |
| x_max = stat.at[ "max", 'total_distance'] | |
| x_min = 0.0 | |
| for axis in [ ax1, bx1 ]: | |
| axis.set_xlim( [ x_min, x_max ] ) | |
| axis.set_xticks( list( range( math.ceil( x_max ) ) ) ) | |
| axis.set_xlabel( 'distance [km]' ) | |
| y_a_N_ticks = 7 | |
| y_a1_ticks = 10 | |
| y_a1_max = math.floor( stat.at[ "max", 'avg_stance_time'] / 10) * 10 + 2 * y_a1_ticks | |
| y_a1_min = y_a1_max - y_a_N_ticks * y_a1_ticks | |
| y_a2_max = math.floor( stat.at[ "mean", 'avg_vertical_oscillation'] / 10) * 10 + 4 * y_a1_ticks | |
| y_a2_min = y_a2_max - y_a_N_ticks * y_a1_ticks | |
| y_a_N_ticks = 7 | |
| y_b1_max = 360 # pace [seconds / km] | |
| y_b1_min = 240 # pace [seconds / km] | |
| y_b1_ticks = 30 # pace [seconds / km] | |
| y_b2_max = 130 # altitude [m], Heart Rate Reserved [%HRR] | |
| y_b2_min = 50 | |
| ax2.text( x_max / 2, y_a2_min + (y_a2_max - y_a2_min) * 0.01, "window function: hann, length =" + str( WNDW_LEN ) + " samples (sample/sec)", size = 8 ) | |
| bx2.text( x_max / 2, y_b2_min + (y_b2_max - y_b2_min) * 0.01, "window function: hann, length =" + str( WNDW_LEN ) + " samples (sample/sec)", size = 8 ) | |
| ax1.set_ylim( [ y_a1_min, y_a1_max ] ) | |
| ax1.set_yticks( list( range( y_a1_min, y_a1_max + 1, y_a1_ticks ) ) ) | |
| ax1.set_ylabel( 'ground gontact time (GCT) [ms]\npitch [steps/min]' ) | |
| ax2.set_ylim( [ y_a2_min, y_a2_max ] ) | |
| ax2.set_ylabel( 'vertical oscillation [mm]' ) | |
| bx1.set_ylim( [ y_b1_max, y_b1_min ] ) | |
| bx1.set_yticks( list( range( y_b1_min, y_b1_max + 1, y_b1_ticks ) ) ) | |
| bx1.yaxis.set_ticklabels( [ fu.second2MS( s ) for s in range( y_b1_min, y_b1_max + 1, y_b1_ticks ) ] ) | |
| bx1.set_ylabel( 'pace [mm:ss/km]' ) | |
| bx2.set_ylim( [ y_b2_min, y_b2_max ] ) | |
| bx2.set_ylabel( 'altitude [m]\nHeart Rate Reserved [%HRR]' ) | |
| def convert_session( session ): | |
| labels_funcs = { | |
| "total_distance": { "func": fu.m2km, "new_label_str": "total_distance" }, | |
| "speed": { "func": fu.speed2pace, "new_label_str": "PACE" }, | |
| "heart_rate": { "func": fu.hr2hrr, "new_label_str": "%HRR" }, | |
| "running_cadence": { "func": fu.cadence2pitch, "new_label_str": "PITCH" }, | |
| } | |
| for key in session.columns.values: | |
| for lb in labels_funcs.keys(): | |
| if (lb in key) and ("_unit" not in key): | |
| session[ key.replace( lb, labels_funcs[ lb ][ "new_label_str" ] ) ] = session[ key ].apply( labels_funcs[ lb ][ "func" ] ) | |
| def convert_data( data ): | |
| labels_funcs = {} | |
| labels_change = [] | |
| for label, item in zip( PLOT_SETTING.keys(), PLOT_SETTING.values() ): | |
| if item[ "convert" ] != None: | |
| labels_funcs[ item[ "source" ] ] = { "func": item[ "convert" ], "new_label": label } | |
| else: | |
| labels_change.append( { item[ "source" ]: label } ) | |
| for x in labels_change: | |
| data.rename( columns = x, inplace=True) | |
| for key in data.columns.values: | |
| for lb in labels_funcs.keys(): | |
| if key == lb: | |
| if labels_funcs[ lb ][ "func" ] != None: | |
| data[ labels_funcs[ lb ][ "new_label" ] ] = data[ key ].apply( labels_funcs[ lb ][ "func" ] ) | |
| data.replace( [np.inf, -np.inf], np.nan, inplace = True ) | |
| data.dropna( subset = [ "PACE" ], inplace=True ) | |
| for lb in [ label for label, item in zip( PLOT_SETTING.keys(), PLOT_SETTING.values() ) if item[ "filtered" ] ]: | |
| add_filterd_data( data, lb, WINDOW ) | |
| def add_filterd_data( data, col, window ): | |
| ar = [] | |
| col_nm = col + "_filtered" | |
| padding = [ float( "NaN" ) for x in range( len( window ) // 2 ) ] | |
| ar.extend( padding ) | |
| ar.extend( smooth( data[ col ], window ) ) | |
| ar.extend( padding ) | |
| data[ col_nm ] = ar | |
| def smooth( d, w ): | |
| return np.convolve( d, w, mode = 'same' )[ len( w )// 2 : -len( w ) // 2 ] | |
| def snip( data, snip ): | |
| return data[ snip : -snip ] | |
| def get_localtimef( v, h, dt ): | |
| tf = TimezoneFinder() | |
| tz = pytz.timezone( tf.timezone_at( lat = v, lng = h ) ) | |
| if dt.tzinfo: | |
| dt.replace( tzinfo = None ) | |
| else: | |
| dt += tz.utcoffset( dt ) | |
| dt = tz.localize( dt ) | |
| return "{}".format( dt.astimezone( tz ) ) | |
| def get_local_session_start_time( s ): | |
| # print( fu.semicircles2dgree( s[ "start_position_lat" ] ), fu.semicircles2dgree( s[ "start_position_long" ] ), s[ "start_time" ] ) | |
| v = fu.semicircles2dgree( s[ "start_position_lat" ] ) | |
| h = fu.semicircles2dgree( s[ "start_position_long" ] ) | |
| dt = s[ "start_time" ] | |
| tf = TimezoneFinder() | |
| tz = pytz.timezone( tf.timezone_at( lat = v, lng = h ) ) | |
| if dt.tzinfo: | |
| dt.replace( tzinfo = None ) | |
| else: | |
| dt += tz.utcoffset( dt ) | |
| dt = tz.localize( dt ) | |
| return "{}".format( dt.astimezone( tz ) ) | |
| if __name__ == "__main__": | |
| main() |
Sign up for free
to join this conversation on GitHub.
Already have an account?
Sign in to comment
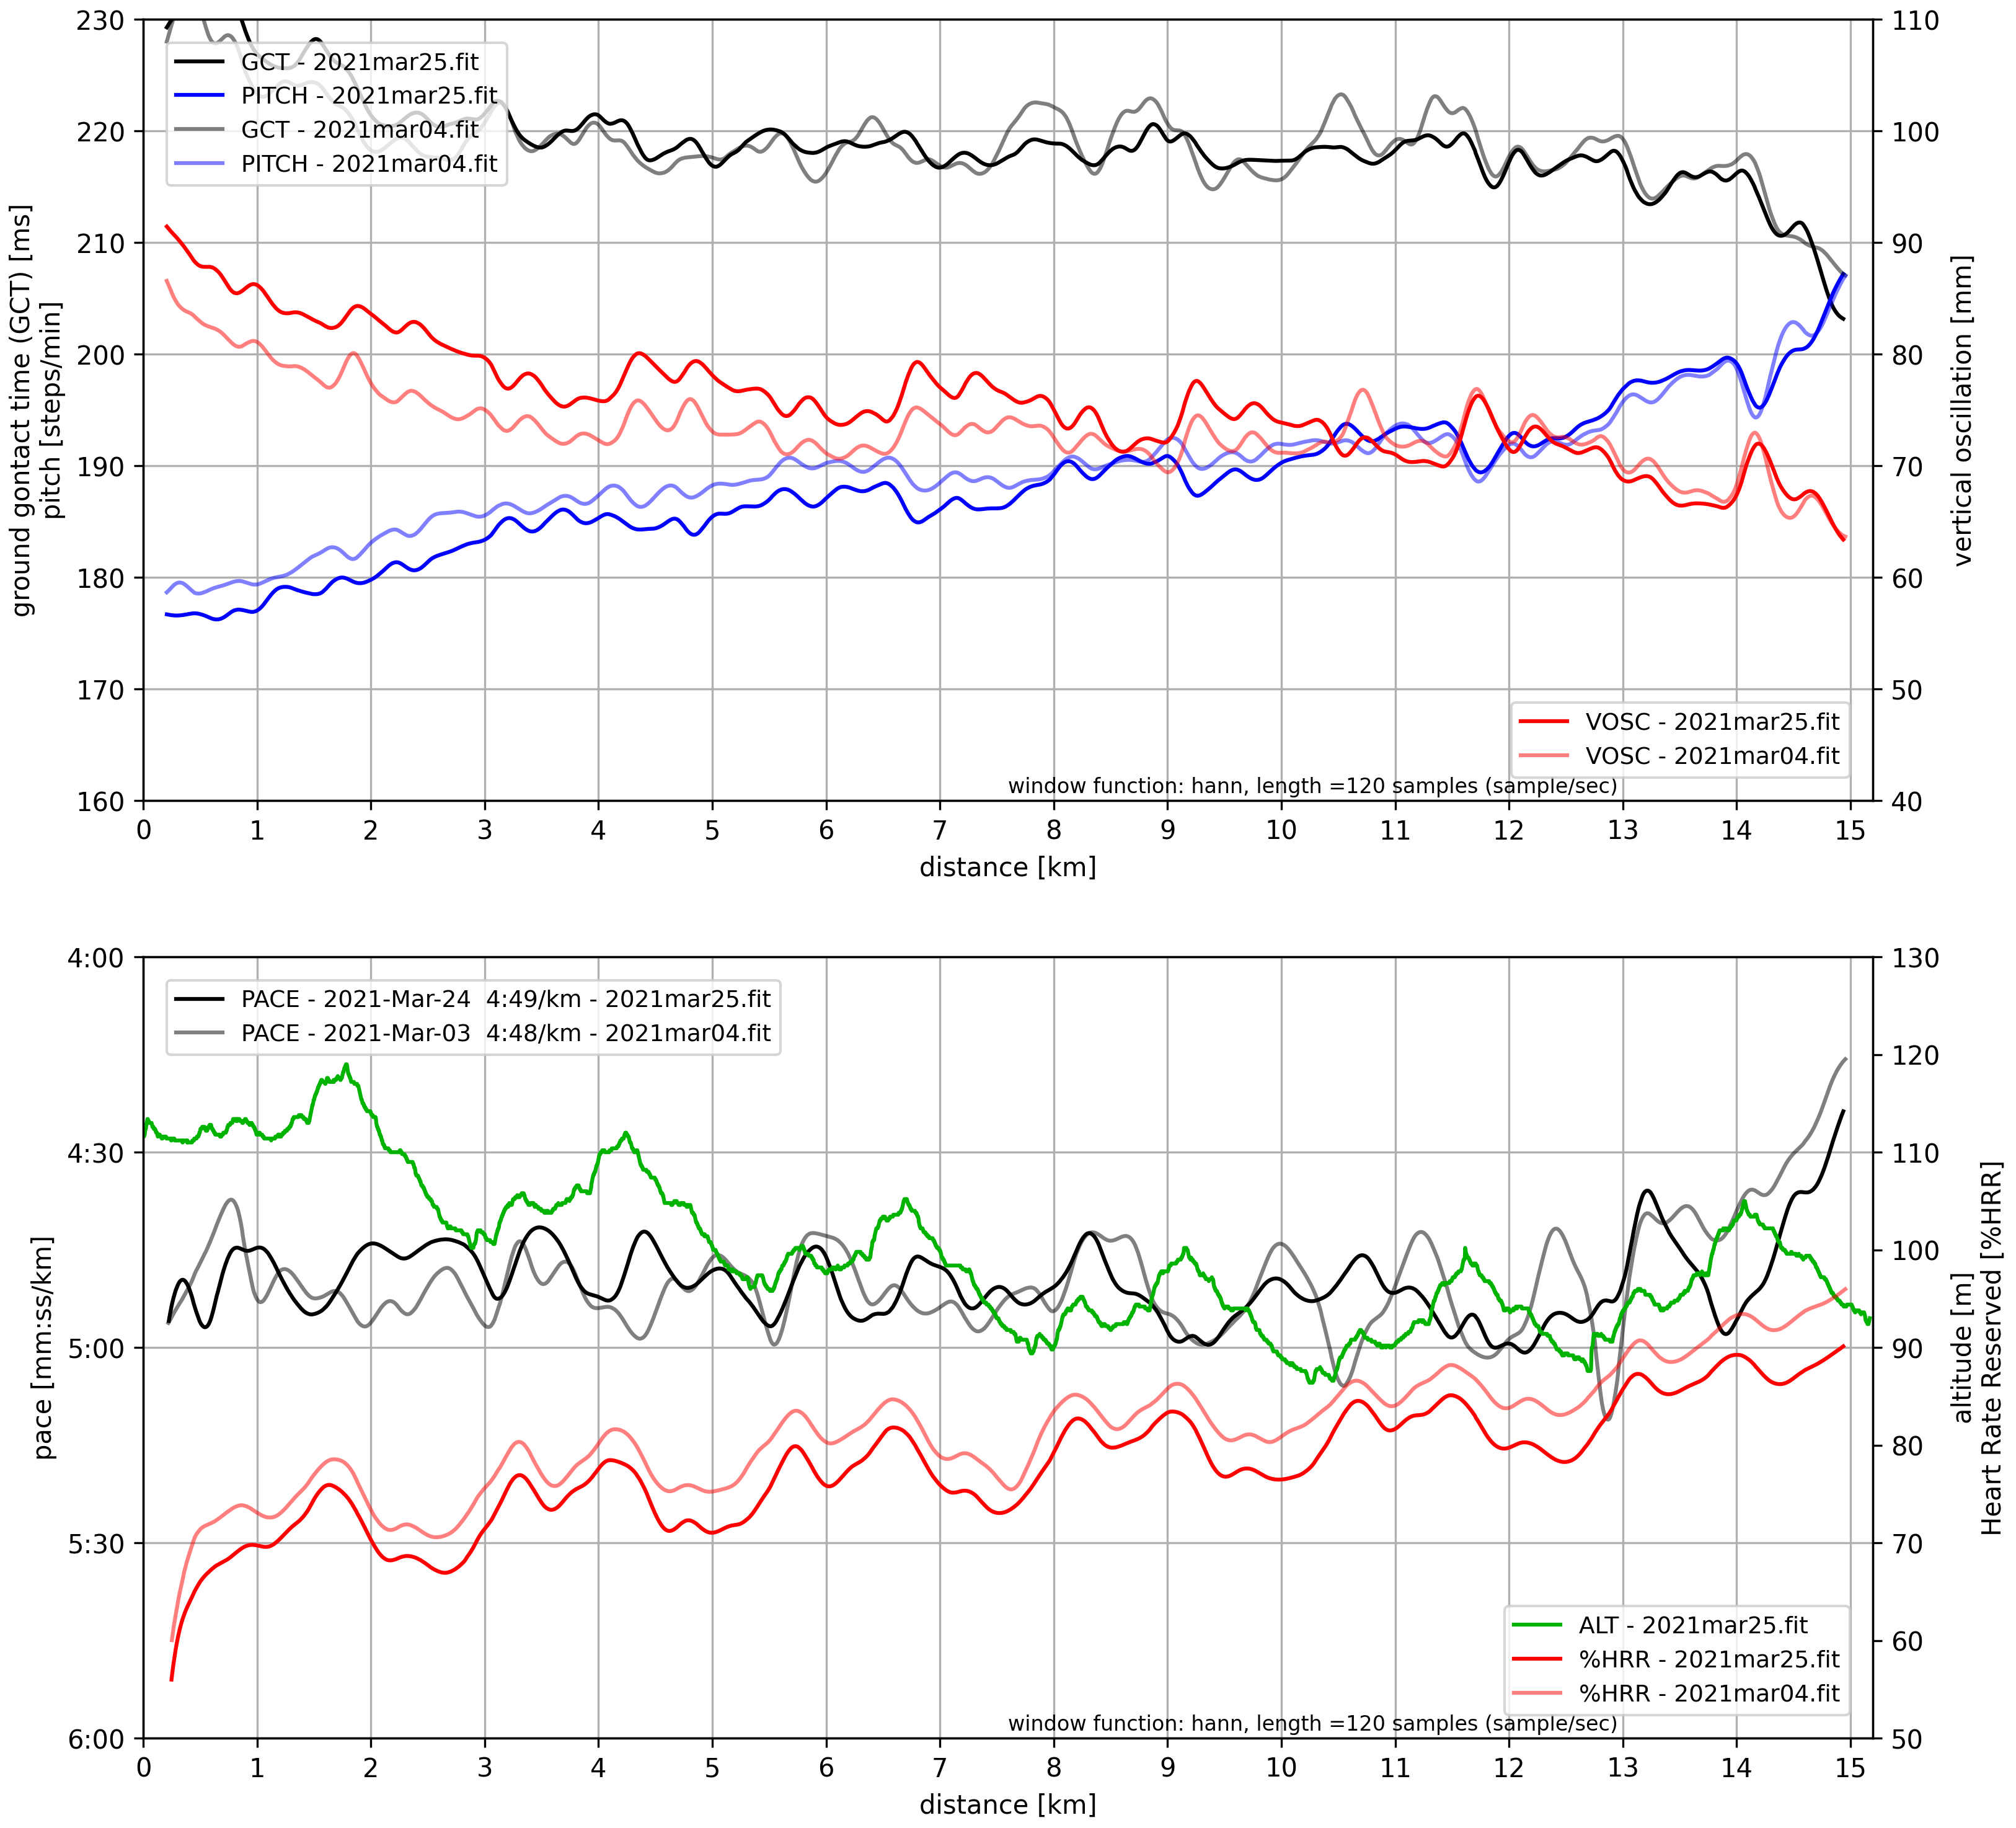
plots .fit file data